Dollar General 2003 Annual Report Download - page 26
Download and view the complete annual report
Please find page 26 of the 2003 Dollar General annual report below. You can navigate through the pages in the report by either clicking on the pages listed below, or by using the keyword search tool below to find specific information within the annual report.-
 1
1 -
2
-
3
-
4
-
5
-
6
-
7
-
8
-
9
-
10
-
11
-
12
-
13
-
14
-
15
-
 16
16 -
 17
17 -
 18
18 -
 19
19 -
 20
20 -
 21
21 -
 22
22 -
 23
23 -
 24
24 -
 25
25 -
 26
26 -
 27
27 -
 28
28 -
 29
29 -
 30
30 -
 31
31 -
 32
32 -
 33
33 -
 34
34 -
 35
35 -
 36
36 -
37
-
38
-
39
-
40
-
41
-
42
-
43
-
44
-
45
-
46
-
47
-
48
-
49
-
50
-
51
-
52
-
53
-
54
 |
 |

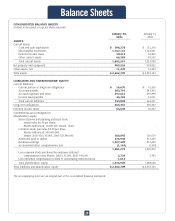
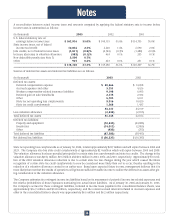
CONSOLIDATED BALANCE SHEETS
(Dollars in thousands except per share amounts)
January 30, January 31,
2004 2003
––––––––––––––––––––––––– ––––––––––––––––––––––
ASSETS
Current assets:
Cash and cash equivalents $ 398,278 $ 121,318
Merchandise inventories 1,157,141 1,123,031
Deferred income taxes 30,413 33,860
Other current assets 66,383 45,699
–––––––––––––––––––––––––––––––––––––––––––––––––––––––––––––––––––––––––––––––––––––––––––––––––––––––––––––––––––––––––––––––––––––––––––––––––––––––––––––––––––––––
Total current assets 1,652,215 1,323,908
–––––––––––––––––––––––––––––––––––––––––––––––––––––––––––––––––––––––––––––––––––––––––––––––––––––––––––––––––––––––––––––––––––––––––––––––––––––––––––––––––––––––
Net property and equipment 989,224 993,822
–––––––––––––––––––––––––––––––––––––––––––––––––––––––––––––––––––––––––––––––––––––––––––––––––––––––––––––––––––––––––––––––––––––––––––––––––––––––––––––––––––––––
Other assets, net 11,270 15,423
–––––––––––––––––––––––––––––––––––––––––––––––––––––––––––––––––––––––––––––––––––––––––––––––––––––––––––––––––––––––––––––––––––––––––––––––––––––––––––––––––––––––
Total assets $ 2,652,709 $ 2,333,153
–––––––––––––––––––––––––––––––––––––––––––––––––––––––––––––––––––––––––––––––––––––––––––––––––––––––––––––––––––––––––––––––––––––––––––––––––––––––––––––––––––––––
–––––––––––––––––––––––––––––––––––––––––––––––––––––––––––––––––––––––––––––––––––––––––––––––––––––––––––––––––––––––––––––––––––––––––––––––––––––––––––––––––––––––
LIABILITIES AND SHAREHOLDERS’ EQUITY
Current liabilities:
Current portion of long-term obligations $ 16,670 $ 16,209
Accounts payable 383,791 341,303
Accrued expenses and other 297,616 239,898
Income taxes payable 45,725 67,091
–––––––––––––––––––––––––––––––––––––––––––––––––––––––––––––––––––––––––––––––––––––––––––––––––––––––––––––––––––––––––––––––––––––––––––––––––––––––––––––––––––––––
Total current liabilities 743,802 664,501
–––––––––––––––––––––––––––––––––––––––––––––––––––––––––––––––––––––––––––––––––––––––––––––––––––––––––––––––––––––––––––––––––––––––––––––––––––––––––––––––––––––––
Long-term obligations 265,337 330,337
–––––––––––––––––––––––––––––––––––––––––––––––––––––––––––––––––––––––––––––––––––––––––––––––––––––––––––––––––––––––––––––––––––––––––––––––––––––––––––––––––––––––
Deferred income taxes 66,650 50,247
–––––––––––––––––––––––––––––––––––––––––––––––––––––––––––––––––––––––––––––––––––––––––––––––––––––––––––––––––––––––––––––––––––––––––––––––––––––––––––––––––––––––
Commitments and contingencies
Shareholders’ equity:
Series B junior participating preferred stock,
stated value $0.50 per share;
Shares authorized: 10,000,000; Issued: None - -
Common stock, par value $0.50 per share;
Shares authorized: 500,000,000;
Issued: 2003-336,190,000; 2002-333,340,000 168,095 166,670
Additional paid-in capital 376,930 313,269
Retained earnings 1,037,409 812,220
Accumulated other comprehensive loss (1,161) (1,349)
–––––––––––––––––––––––––––––––––––––––––––––––––––––––––––––––––––––––––––––––––––––––––––––––––––––––––––––––––––––––––––––––––––––––––––––––––––––––––––––––––––––––
1,581,273 1,290,810
Less common stock purchased by employee deferred
compensation trust; Shares: 2003-151,000; 2002-140,000 2,739 2,742
Less unearned compensation related to outstanding restricted stock 1,614 -
–––––––––––––––––––––––––––––––––––––––––––––––––––––––––––––––––––––––––––––––––––––––––––––––––––––––––––––––––––––––––––––––––––––––––––––––––––––––––––––––––––––––
Total shareholders’ equity 1,576,920 1,288,068
–––––––––––––––––––––––––––––––––––––––––––––––––––––––––––––––––––––––––––––––––––––––––––––––––––––––––––––––––––––––––––––––––––––––––––––––––––––––––––––––––––––––
Total liabilities and shareholders’ equity $ 2,652,709 $ 2,333,153
–––––––––––––––––––––––––––––––––––––––––––––––––––––––––––––––––––––––––––––––––––––––––––––––––––––––––––––––––––––––––––––––––––––––––––––––––––––––––––––––––––––––
–––––––––––––––––––––––––––––––––––––––––––––––––––––––––––––––––––––––––––––––––––––––––––––––––––––––––––––––––––––––––––––––––––––––––––––––––––––––––––––––––––––––
The accompanying notes are an integral part of the consolidated financial statements.
Balance Sheets
24