Dollar General 2003 Annual Report Download - page 19
Download and view the complete annual report
Please find page 19 of the 2003 Dollar General annual report below. You can navigate through the pages in the report by either clicking on the pages listed below, or by using the keyword search tool below to find specific information within the annual report.-
 1
1 -
2
-
3
-
4
-
5
-
6
-
7
-
8
-
 9
9 -
 10
10 -
 11
11 -
 12
12 -
 13
13 -
 14
14 -
 15
15 -
 16
16 -
 17
17 -
 18
18 -
 19
19 -
 20
20 -
 21
21 -
 22
22 -
 23
23 -
 24
24 -
 25
25 -
 26
26 -
 27
27 -
 28
28 -
 29
29 -
30
-
31
-
32
-
33
-
34
-
35
-
36
-
37
-
38
-
39
-
40
-
41
-
42
-
43
-
44
-
45
-
46
-
47
-
48
-
49
-
50
-
51
-
52
-
53
-
54
 |
 |

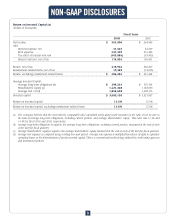
During 2003, the Company purchased two secured promissory notes totaling $49.6 million which represent debt issued by a third
party entity from which the Company leases its DC in South Boston, Virginia. See Note 7 to the Company’s Consolidated Financial
Statements.
The Company’s purchases of property and equipment in 2002 included the following: $50.9 million for new, relocated and remod-
eled stores; $30.2 million for systems-related capital projects; and $21.3 million for distribution and transportation-related capital
expenditures. The Company opened 622 new stores and relocated or remodeled 73 stores in 2002. Systems-related capital proj-
ects in 2002 included $15.0 million for satellite technology and $3.0 million for point-of-sale cash registers. Expenditures for dis-
tribution and transportation consisted in part of $8.3 million for the purchase of new trailers and $5.0 million related to the instal-
lation of a dual sortation system in the Fulton, Missouri DC.
The Company’s purchases of property and equipment in 2001 included the following: $55.8 million for new, relocated and remod-
eled stores; $31.7 million for systems-related capital projects; and $6.6 million on distribution and transportation-related capital
expenditures. The Company opened 602 new stores and relocated or remodeled 78 stores in 2001. Systems-related capital proj-
ects in 2001 included $10.0 million for satellite technology and $8.3 million for new point-of-sale cash registers.
Capital expenditures during 2004 are projected to be approximately $300 million. The Company anticipates funding its 2004 capi-
tal requirements with cash flows from operations and the Credit Facility, if necessary. Significant components of the 2004 capital
plan include, in order of anticipated magnitude, leasehold improvements and fixtures and equipment for 695 new stores, which
includes 20 new Dollar General Market stores; the construction of the new DC in Union County, South Carolina; expansions and
equipment upgrades of the Company’s DCs in Ardmore, Oklahoma and South Boston, Virginia; the rollout of coolers into approxi-
mately 2,850 existing stores; and the cost of some additional store fixtures related to merchandising initiatives. The Company plans
to undertake these expenditures in order to improve its infrastructure and provide support for its continued growth.
Cash flows used in financing activities. The Company paid cash dividends of $46.9 million, or $0.14 per share, on its outstanding
common stock during 2003. The Company repurchased approximately 1.5 million shares of its common stock during 2003 at a total
cost of $29.7 million, as discussed above. The Company expended $15.9 million during 2003 to reduce its outstanding capital lease
and financing obligations. These uses of cash were partially offset by proceeds from the exercise of stock options during 2003 of
$49.5 million. The use of cash in 2002 reflects the net repayment of $397.1 million in outstanding debt and the payment of $42.6
million of cash dividends. The net repayment of debt was undertaken to strengthen the Company’s financial position and was
accomplished by utilizing cash flow from operations and existing cash balances. The use of cash in 2001 primarily represented the
payment of $42.5 million in dividends.
Critical Accounting Policies and Estimates
Merchandise Inventories. Merchandise inventories are stated at the lower of cost or market with cost determined using the retail
last-in, first-out ("LIFO") method. Under the retail inventory method ("RIM"), the valuation of inventories at cost and the resulting
gross margins are calculated by applying a calculated cost-to-retail ratio to the retail value of inventories. The RIM is an averag-
ing method that has been widely used in the retail industry due to its practicality. Also, it is recognized that the use of the RIM will
result in valuing inventories at the lower of cost or market if markdowns are currently taken as a reduction of the retail value of
inventories.
Inherent in the RIM calculation are certain significant management judgments and estimates including, among others, initial
markups, markdowns, and shrinkage, which significantly impact the ending inventory valuation at cost as well as resulting gross
margins. These significant estimates, coupled with the fact that the RIM is an averaging process, can, under certain circumstances,
produce distorted cost figures. Factors that can lead to distortion in the calculation of the inventory balance include:
• applying the RIM to a group of products that is not fairly uniform in terms of its cost and selling price relationship and
turnover
• applying the RIM to transactions over a period of time that include different rates of gross profit, such as those relating to
seasonal merchandise
• inaccurate estimates of inventory shrinkage between the date of the last physical inventory at a store and the financial
statement date
• inaccurate estimates of LIFO reserves
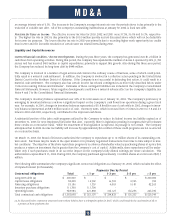
To reduce the potential of such distortions in the valuation of inventory, the Company’s RIM currently utilizes 10 departments in
which fairly homogenous classes of merchandise inventories having similar gross margins are grouped. In the near future, in order
M D & A
17