Dollar General 2003 Annual Report Download - page 29
Download and view the complete annual report
Please find page 29 of the 2003 Dollar General annual report below. You can navigate through the pages in the report by either clicking on the pages listed below, or by using the keyword search tool below to find specific information within the annual report.-
 1
1 -
2
-
3
-
4
-
5
-
6
-
7
-
8
-
9
-
10
-
11
-
12
-
13
-
14
-
15
-
16
-
17
-
18
-
 19
19 -
 20
20 -
 21
21 -
 22
22 -
 23
23 -
 24
24 -
 25
25 -
 26
26 -
 27
27 -
 28
28 -
 29
29 -
 30
30 -
 31
31 -
 32
32 -
 33
33 -
 34
34 -
 35
35 -
 36
36 -
 37
37 -
 38
38 -
 39
39 -
40
-
41
-
42
-
43
-
44
-
45
-
46
-
47
-
48
-
49
-
50
-
51
-
52
-
53
-
54
 |
 |

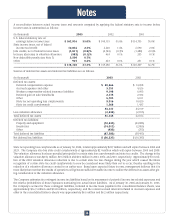
CONSOLIDATED STATEMENTS OF CASH FLOWS
(Dollars in thousands)
For the years ended
––––––––––––––––––––––––––––––––––––––––––––––––––––––––––––––––––––––––––––––––––––––––––––––––
January 30, 2004 January 31, 2003 February 1, 2002
––––––––––––––––––––––––––––––––––––––––––––––––––––––––––––––––––––––––––––––––––––––––––––––––––––––––––––––––––––––––––––––––––––––––––––––––––––––––––––––––––––––––
Cash flows from operating activities:
Net income $ 301,000 $ 264,946 $ 207,513
Adjustments to reconcile net income to net cash
provided by operating activities:
Depreciation and amortization 152,399 134,959 122,967
Deferred income taxes 19,850 82,867 7,743
Tax benefit from stock option exercises 14,565 2,372 5,819
Litigation settlement -(162,000) -
Change in operating assets and liabilities:
Merchandise inventories (34,110) 7,992 (118,788)
Other current assets (20,684) 12,566 (13,540)
Accounts payable 42,488 18,840 25,201
Accrued expenses and other 59,344 14,610 25,907
Income taxes (21,464) 56,458 (5,907)
Other 5,166 430 8,713
––––––––––––––––––––––––––––––––––––––––––––––––––––––––––––––––––––––––––––––––––––––––––––––––––––––––––––––––––––––––––––––––––––––––––––––––––––––––––––––––––––––––
Net cash provided by operating activities 518,554 434,040 265,628
––––––––––––––––––––––––––––––––––––––––––––––––––––––––––––––––––––––––––––––––––––––––––––––––––––––––––––––––––––––––––––––––––––––––––––––––––––––––––––––––––––––––
Cash flows from investing activities:
Purchase of property and equipment (149,362) (134,315) (125,365)
Purchase of promissory notes (see Note 7) (49,582) --
Proceeds from sale of property and equipment 269 481 1,293
––––––––––––––––––––––––––––––––––––––––––––––––––––––––––––––––––––––––––––––––––––––––––––––––––––––––––––––––––––––––––––––––––––––––––––––––––––––––––––––––––––––––
Net cash used in investing activities (198,675) (133,834) (124,072)
––––––––––––––––––––––––––––––––––––––––––––––––––––––––––––––––––––––––––––––––––––––––––––––––––––––––––––––––––––––––––––––––––––––––––––––––––––––––––––––––––––––––
Cash flows from financing activities:
Repayments of long-term obligations (15,907) (397,094) (11,823)
Payment of cash dividends (46,883) (42,638) (42,517)
Proceeds from exercise of stock options 49,485 5,021 12,268
Repurchase of common stock, net (29,687) --
Other financing activities 73 (5,702) (269)
––––––––––––––––––––––––––––––––––––––––––––––––––––––––––––––––––––––––––––––––––––––––––––––––––––––––––––––––––––––––––––––––––––––––––––––––––––––––––––––––––––––––
Net cash used in financing activities (42,919) (440,413) (42,341)
––––––––––––––––––––––––––––––––––––––––––––––––––––––––––––––––––––––––––––––––––––––––––––––––––––––––––––––––––––––––––––––––––––––––––––––––––––––––––––––––––––––––
Net increase (decrease) in cash and cash equivalents 276,960 (140,207) 99,215
Cash and cash equivalents, beginning of year 121,318 261,525 162,310
––––––––––––––––––––––––––––––––––––––––––––––––––––––––––––––––––––––––––––––––––––––––––––––––––––––––––––––––––––––––––––––––––––––––––––––––––––––––––––––––––––––––
Cash and cash equivalents, end of year $ 398,278 $ 121,318 $ 261,525
––––––––––––––––––––––––––––––––––––––––––––––––––––––––––––––––––––––––––––––––––––––––––––––––––––––––––––––––––––––––––––––––––––––––––––––––––––––––––––––––––––––––
––––––––––––––––––––––––––––––––––––––––––––––––––––––––––––––––––––––––––––––––––––––––––––––––––––––––––––––––––––––––––––––––––––––––––––––––––––––––––––––––––––––––
Supplemental cash flow information:
Cash paid during year for:
Interest $ 28,682 $ 41,605 $ 50,297
Income taxes $ 165,248 $ 1,834 $ 110,944
––––––––––––––––––––––––––––––––––––––––––––––––––––––––––––––––––––––––––––––––––––––––––––––––––––––––––––––––––––––––––––––––––––––––––––––––––––––––––––––––––––––––
Supplemental schedule of noncash investing
and financing activities:
Purchase of property and equipment under
capital lease obligations $ 996 $ 8,453 $ 17,169
––––––––––––––––––––––––––––––––––––––––––––––––––––––––––––––––––––––––––––––––––––––––––––––––––––––––––––––––––––––––––––––––––––––––––––––––––––––––––––––––––––––––
The accompanying notes are an integral part of the consolidated financial statements.
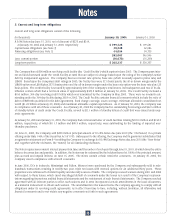
Cash Flows
27