Dollar General 2003 Annual Report Download - page 36
Download and view the complete annual report
Please find page 36 of the 2003 Dollar General annual report below. You can navigate through the pages in the report by either clicking on the pages listed below, or by using the keyword search tool below to find specific information within the annual report.-
 1
1 -
2
-
3
-
4
-
5
-
6
-
7
-
8
-
9
-
10
-
11
-
12
-
13
-
14
-
15
-
16
-
17
-
18
-
19
-
20
-
21
-
22
-
23
-
24
-
25
-
 26
26 -
 27
27 -
 28
28 -
 29
29 -
 30
30 -
 31
31 -
 32
32 -
 33
33 -
 34
34 -
 35
35 -
 36
36 -
 37
37 -
 38
38 -
 39
39 -
 40
40 -
 41
41 -
 42
42 -
 43
43 -
 44
44 -
 45
45 -
 46
46 -
47
-
48
-
49
-
50
-
51
-
52
-
53
-
54
 |
 |

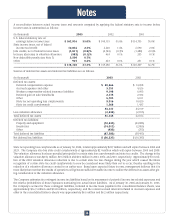
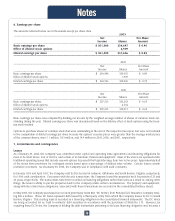
A reconciliation between actual income taxes and amounts computed by applying the federal statutory rate to income before
income taxes is summarized as follows:
(In thousands) 2003 2002 2001
–––––––––––––––––––––––––––––––––––––––––––––––––––––––––––––––––––––––––––––––––––––––––––––––––––––––––––––––––––––––––––––––––––––––––––––––––––––––––––––––––––––––-
U.S. federal statutory rate on
earnings before income taxes $ 167,916 35.0% $ 145,119 35.0% $ 114,735 35.0%
State income taxes, net of federal
income tax benefit 10,836 2.3% 6,620 1.6% 6,590 2.0%
Jobs credits, net of federal income taxes (3,817) (0.8)% (2,745) (0.7)% (1,480) (0.5)%
Increase (decrease) in valuation allowance (582) (0.1)% 463 0.1% 233 0.1%
Non-deductible penalty (see Note 7) 3,500 0.7% -- - -
Other 907 0.2% 223 0.1% 231 0.1%
–––––––––––––––––––––––––––––––––––––––––––––––––––––––––––––––––––––––––––––––––––––––––––––––––––––––––––––––––––––––––––––––––––––––––––––––––––––––––––––––––––––––-
$ 178,760 37.3% $ 149,680 36.1% $ 120,309 36.7%
–––––––––––––––––––––––––––––––––––––––––––––––––––––––––––––––––––––––––––––––––––––––––––––––––––––––––––––––––––––––––––––––––––––––––––––––––––––––––––––––––––––––-
–––––––––––––––––––––––––––––––––––––––––––––––––––––––––––––––––––––––––––––––––––––––––––––––––––––––––––––––––––––––––––––––––––––––––––––––––––––––––––––––––––––––-
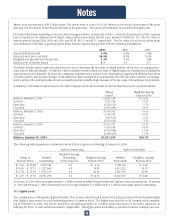
Sources of deferred tax assets and deferred tax liabilities are as follows:
(In thousands) 2003 2002
–––––––––––––––––––––––––––––––––––––––––––––––––––––––––––––––––––––––––––––––––––––––––––––––––––––––––––––––––––––––––––––––––––––––––––––––––––––––––––––––––––––––-
Deferred tax assets:
Deferred compensation expense $ 20,466 $ 14,098
Accrued expenses and other 3,751 4,526
Workers compensation-related insurance liabilities 9,198 6,905
Deferred gain on sale/leasebacks 2,775 2,922
Other 5,703 5,011
State tax net operating loss carryforwards 9,916 10,020
State tax credit carryforwards 1,568 1,437
–––––––––––––––––––––––––––––––––––––––––––––––––––––––––––––––––––––––––––––––––––––––––––––––––––––––––––––––––––––––––––––––––––––––––––––––––––––––––––––––––––––––-
53,377 44,919
Less valuation allowance (2,232) (2,813)
–––––––––––––––––––––––––––––––––––––––––––––––––––––––––––––––––––––––––––––––––––––––––––––––––––––––––––––––––––––––––––––––––––––––––––––––––––––––––––––––––––––––-
Total deferred tax assets 51,145 42,106
–––––––––––––––––––––––––––––––––––––––––––––––––––––––––––––––––––––––––––––––––––––––––––––––––––––––––––––––––––––––––––––––––––––––––––––––––––––––––––––––––––––––-
Deferred tax liabilities:
Property and equipment (72,430) (54,885)
Inventories (14,017) (2,855)
Other (935) (753)
–––––––––––––––––––––––––––––––––––––––––––––––––––––––––––––––––––––––––––––––––––––––––––––––––––––––––––––––––––––––––––––––––––––––––––––––––––––––––––––––––––––––-
Total deferred tax liabilities (87,382) (58,493)
–––––––––––––––––––––––––––––––––––––––––––––––––––––––––––––––––––––––––––––––––––––––––––––––––––––––––––––––––––––––––––––––––––––––––––––––––––––––––––––––––––––––-
Net deferred tax liabilities $ (36,237) $ (16,387)
–––––––––––––––––––––––––––––––––––––––––––––––––––––––––––––––––––––––––––––––––––––––––––––––––––––––––––––––––––––––––––––––––––––––––––––––––––––––––––––––––––––––-
–––––––––––––––––––––––––––––––––––––––––––––––––––––––––––––––––––––––––––––––––––––––––––––––––––––––––––––––––––––––––––––––––––––––––––––––––––––––––––––––––––––––-
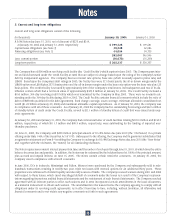
State net operating loss carryforwards as of January 30, 2004, totaled approximately $237 million and will expire between 2004 and
2023. The Company also has state credit carryforwards of approximately $2.4 million which will expire between 2005 and 2008.
The valuation allowance has been provided principally for certain state loss carryforwards and state tax credits. The change in the
valuation allowance was $(0.6) million, $0.5 million and $0.2 million in 2003, 2002, and 2001, respectively. Approximately $1.0 mil-
lion of the 2003 valuation allowance reduction is due to certain state tax law changes during the year which caused the future
recognition of certain state tax credit carryforwards to now be considered more likely than not to occur, thereby resulting in the
reduction of a valuation allowance created in an earlier year. Based upon expected future income, management believes that it is
more likely than not that the results of operations will generate sufficient taxable income to realize the deferred tax assets after giv-
ing consideration to the valuation allowance.
The Company estimates its contingent income tax liabilities based on its assessment of potential income tax-related exposures and
the relative probabilities of those exposures translating into actual future liabilities. As of January 30, 2004 and January 31, 2003,
the Company’s accrual for these contingent liabilities, included in Income taxes payable in the consolidated balance sheets, was
approximately $16.9 million and $14.8 million, respectively, and the related accrued interest included in Accrued expenses and
other in the consolidated balance sheets was approximately $6.6 million and $6.2 million respectively.
Notes
34