Dollar General 2003 Annual Report Download - page 10
Download and view the complete annual report
Please find page 10 of the 2003 Dollar General annual report below. You can navigate through the pages in the report by either clicking on the pages listed below, or by using the keyword search tool below to find specific information within the annual report.-
 1
1 -
 2
2 -
 3
3 -
 4
4 -
 5
5 -
 6
6 -
 7
7 -
 8
8 -
 9
9 -
 10
10 -
 11
11 -
 12
12 -
 13
13 -
 14
14 -
 15
15 -
 16
16 -
 17
17 -
 18
18 -
 19
19 -
 20
20 -
 21
21 -
22
-
23
-
24
-
25
-
26
-
27
-
28
-
29
-
30
-
31
-
32
-
33
-
34
-
35
-
36
-
37
-
38
-
39
-
40
-
41
-
42
-
43
-
44
-
45
-
46
-
47
-
48
-
49
-
50
-
51
-
52
-
53
-
54
 |
 |

NON-GAAP DISCLOSURES
8
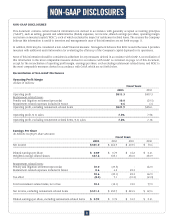
NON-GAAP DISCLOSURES
This document contains certain financial information not derived in accordance with generally accepted accounting principles
("GAAP"), such as selling, general and administrative (SG&A) expenses, net income, diluted earnings per share, operating margin
and return on invested capital ("ROIC"), each of which excludes the impact of restatement-related items. The reasons the Company
believes this information is useful to investors and management’s uses of this information are set forth on page 11.
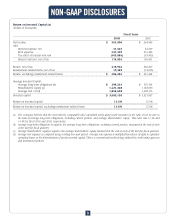
In addition, ROIC may be considered a non-GAAP financial measure. Management believes that ROIC is useful because it provides
investors with additional useful information for evaluating the efficiency of the Company’s capital deployed in its operations.
None of this information should be considered a substitute for any measures derived in accordance with GAAP. A reconciliation of
this information to the most comparable measure derived in accordance with GAAP is contained on page 12 of this document,
except for the reconciliation of operating profit margin, earnings per share, each excluding restatement-related items, and ROIC to
the most comparable measures derived in accordance with GAAP, which are set forth below.
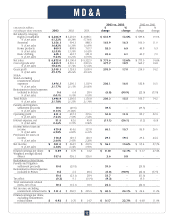
Reconciliation of Non-GAAP Disclosures
Operating Profit Margin
(Dollars in millions)
Fiscal Years
________________________________________________________________________________________________________________________________
2003 2002
________________________________________________________________________________________________________________________________
Operating profit $511.3 $457.3
Restatement-related items:
Penalty and litigation settlement (proceeds) 10.0 (29.5)
Restatement-related expenses included in SG&A 0.6 6.4
Operating profit, excluding restatement-related items $521.9 $434.1
________________________________________________________________________________________________________________________________
________________________________________________________________________________________________________________________________
Operating profit, % to sales 7.4% 7.5%
________________________________________________________________________________________________________________________________
________________________________________________________________________________________________________________________________
Operating profit, excluding restatement-related items, % to sales 7.6% 7.1%
________________________________________________________________________________________________________________________________
________________________________________________________________________________________________________________________________
Earnings Per Share
(In millions except per share amounts)
Fiscal Years
________________________________________________________________________________________________________________________________
2003 2002 2001 2000
________________________________________________________________________________________________________________________________
Net income $ 301.0 $ 264.9 $ 207.5 $ 70.6
________________________________________________________________________________________________________________________________
________________________________________________________________________________________________________________________________
Diluted earnings per share $ 0.89 $ 0.79 $ 0.62 $ 0.21
Weighted average diluted shares 337.6 335.1 335.0 333.9
________________________________________________________________________________________________________________________________
________________________________________________________________________________________________________________________________
Restatement-related items:
Penalty and litigation settlement (proceeds) 10.0 (29.5) - 162.0
Restatement-related expenses included in SG&A 0.6 6.4 28.4 -
________________________________________________________________________________________________________________________________
10.6 (23.1) 28.4 162.0
Tax effect (0.2) 9.1 (10.4) (63.0)
________________________________________________________________________________________________________________________________
Total restatement-related items, net of tax 10.4 (14.1) 18.0 99.0
________________________________________________________________________________________________________________________________
Net income, excluding restatement-related items $ 311.4 $ 250.9 $ 225.5 $ 169.6
________________________________________________________________________________________________________________________________
________________________________________________________________________________________________________________________________
Diluted earnings per share, excluding restatement-related items $ 0.92 $ 0.75 $ 0.67 $ 0.51
________________________________________________________________________________________________________________________________
________________________________________________________________________________________________________________________________