Dollar General 2003 Annual Report Download - page 27
Download and view the complete annual report
Please find page 27 of the 2003 Dollar General annual report below. You can navigate through the pages in the report by either clicking on the pages listed below, or by using the keyword search tool below to find specific information within the annual report.-
 1
1 -
2
-
3
-
4
-
5
-
6
-
7
-
8
-
9
-
10
-
11
-
12
-
13
-
14
-
15
-
16
-
 17
17 -
 18
18 -
 19
19 -
 20
20 -
 21
21 -
 22
22 -
 23
23 -
 24
24 -
 25
25 -
 26
26 -
 27
27 -
 28
28 -
 29
29 -
 30
30 -
 31
31 -
 32
32 -
 33
33 -
 34
34 -
 35
35 -
 36
36 -
 37
37 -
38
-
39
-
40
-
41
-
42
-
43
-
44
-
45
-
46
-
47
-
48
-
49
-
50
-
51
-
52
-
53
-
54
 |
 |

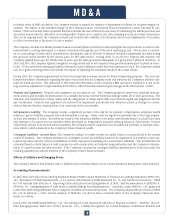
CONSOLIDATED STATEMENTS OF INCOME
(Dollars in thousands except per share amounts)
For the years ended
–––––––––––––––––––––––––––––––––––––––––––––––––––––––––––––––––––––––––––––––––––––––––––––––––––––––––––––––––
January 30, 2004 January 31, 2003 February 1, 2002
––––––––––––––––––––––––––– ––––––––––––––––––––––––––– –––––––––––––––––––––––––––
% of % of % of
Amount Net Sales Amount Net Sales Amount Net Sales
–––––––––––––––––––––––––––––––––––––––––––––––––––––––––––––––––––––––––––––––––––––––––––––––––––––––––––––––––––––––––––––––––––––––––––––––––––––––––––––––––––––––
Net sales $ 6,871,992 100.00% $ 6,100,404 100.00% $ 5,322,895 100.00%
Cost of goods sold 4,853,863 70.63 4,376,138 71.74 3,813,483 71.64
–––––––––––––––––––––––––––––––––––––––––––––––––––––––––––––––––––––––––––––––––––––––––––––––––––––––––––––––––––––––––––––––––––––––––––––––––––––––––––––––––––––––
Gross profit 2,018,129 29.37 1,724,266 28.26 1,509,412 28.36
Selling, general and administrative 1,496,866 21.78 1,296,542 21.25 1,135,801 21.34
Penalty and litigation
settlement proceeds 10,000 0.15 (29,541) (0.48) - -
–––––––––––––––––––––––––––––––––––––––––––––––––––––––––––––––––––––––––––––––––––––––––––––––––––––––––––––––––––––––––––––––––––––––––––––––––––––––––––––––––––––––
Operating profit 511,263 7.44 457,265 7.50 373,611 7.02
Interest expense, net 31,503 0.46 42,639 0.70 45,789 0.86
–––––––––––––––––––––––––––––––––––––––––––––––––––––––––––––––––––––––––––––––––––––––––––––––––––––––––––––––––––––––––––––––––––––––––––––––––––––––––––––––––––––––
Income before taxes on income 479,760 6.98 414,626 6.80 327,822 6.16
Provisions for taxes on income 178,760 2.60 149,680 2.45 120,309 2.26
–––––––––––––––––––––––––––––––––––––––––––––––––––––––––––––––––––––––––––––––––––––––––––––––––––––––––––––––––––––––––––––––––––––––––––––––––––––––––––––––––––––––
Net income $ 301,000 4.38% $ 264,946 4.34% $ 207,513 3.90%
–––––––––––––––––––––––––––––––––––––––––––––––––––––––––––––––––––––––––––––––––––––––––––––––––––––––––––––––––––––––––––––––––––––––––––––––––––––––––––––––––––––––
–––––––––––––––––––––––––––––––––––––––––––––––––––––––––––––––––––––––––––––––––––––––––––––––––––––––––––––––––––––––––––––––––––––––––––––––––––––––––––––––––––––––
Diluted earnings per share $ 0.89 $ 0.79 $ 0.62
Weighted average diluted shares (000s) 337,636 335,050 335,017
Basic earnings per share $ 0.90 $ 0.80 $ 0.63
Weighted average basic shares (000s) 334,697 333,055 332,263
–––––––––––––––––––––––––––––––––––––––––––––––––––––––––––––––––––––––––––––––––––––––––––––––––––––––––––––––––––––––––––––––––––––––––––––––––––––––––––––––––––––––
–––––––––––––––––––––––––––––––––––––––––––––––––––––––––––––––––––––––––––––––––––––––––––––––––––––––––––––––––––––––––––––––––––––––––––––––––––––––––––––––––––––––
The accompanying notes are an integral part of the consolidated financial statements.
Income Statements
25