Dollar General 2003 Annual Report Download - page 43
Download and view the complete annual report
Please find page 43 of the 2003 Dollar General annual report below. You can navigate through the pages in the report by either clicking on the pages listed below, or by using the keyword search tool below to find specific information within the annual report.-
 1
1 -
2
-
3
-
4
-
5
-
6
-
7
-
8
-
9
-
10
-
11
-
12
-
13
-
14
-
15
-
16
-
17
-
18
-
19
-
20
-
21
-
22
-
23
-
24
-
25
-
26
-
27
-
28
-
29
-
30
-
31
-
32
-
 33
33 -
 34
34 -
 35
35 -
 36
36 -
 37
37 -
 38
38 -
 39
39 -
 40
40 -
 41
41 -
 42
42 -
 43
43 -
 44
44 -
 45
45 -
 46
46 -
 47
47 -
 48
48 -
 49
49 -
 50
50 -
 51
51 -
 52
52 -
 53
53 -
54
 |
 |

hundredth of a share (a "Unit") of Series B Junior Participating Preferred Stock (the "Preferred Stock"), no par value, at a purchase
price of $100 per Unit, subject to adjustment. Initially, the Rights will attach to all certificates representing shares of outstanding
common stock, and no separate Rights Certificates will be distributed. The Rights will become exercisable upon the occurrence of
a triggering event as defined in the Plan.
On March 13, 2003, the Company was granted the authority by its Board of Directors to repurchase up to 12 million shares of its
outstanding common stock. This authorization expires March 13, 2005. During the fourth quarter of 2003, 1,519,000 shares were
repurchased at a total cost of $29.7 million.
11. Related party transactions
In 2002, Cal Turner, the Company’s then Chairman and Chief Executive Officer, made voluntary payments to the Company totaling
approximately $6.8 million in cash. Of such amount, approximately $6.0 million represented the value on April 10, 2002 of stock
Mr. Turner acquired on April 7, 1999 and April 20, 2000 upon the exercise of stock options (net of the strike price of such options)
and approximately $0.8 million represented the value of performance-based bonuses received by Mr. Turner in April 1999 and April
2000. Mr. Turner voluntarily paid such amounts to the Company because the options vested and the performance bonuses were
paid based on performance measures that were attained under the Company’s originally reported financial results for the period
covered by the Company’s restatement. Those measures would not have been attained under the subsequently restated results.
The Company recorded the approximately $6.0 million receipt as a contribution of capital, which was recorded as an increase in
Additional paid-in capital in the consolidated balance sheet as of January 31, 2003. The Company recorded the approximately $0.8
million receipt as a reduction of SG&A expenses during the third quarter of 2002.
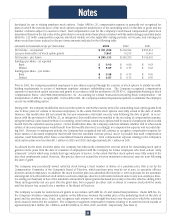
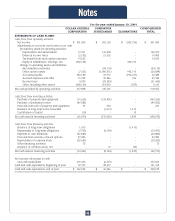
12. Segment reporting
The Company manages its business on the basis of one reportable segment. See Note 1 for a brief description of the Company’s
business. As of January 30, 2004, all of the Company’s retail operations were located within the United States. The following data
is presented in accordance with SFAS No. 131, "Disclosures about Segments of an Enterprise and Related Information."
(In thousands) 2003 2002 2001
–––––––––––––––––––––––––––––––––––––––––––––––––––––––––––––––––––––––––––––––––––––––––––––––––––––––––––––––––––––––––––––––––––––––––––––––––––––––––––––––––––––––-
Classes of similar products:
Net sales:
Highly consumable $ 4,206,878 $ 3,674,929 $ 3,085,112
Seasonal 1,156,114 994,250 888,263
Home products 860,867 808,518 767,720
Basic clothing 648,133 622,707 581,800
–––––––––––––––––––––––––––––––––––––––––––––––––––––––––––––––––––––––––––––––––––––––––––––––––––––––––––––––––––––––––––––––––––––––––––––––––––––––––––––––––––––––-
$ 6,871,992 $ 6,100,404 $ 5,322,895
–––––––––––––––––––––––––––––––––––––––––––––––––––––––––––––––––––––––––––––––––––––––––––––––––––––––––––––––––––––––––––––––––––––––––––––––––––––––––––––––––––––––-
–––––––––––––––––––––––––––––––––––––––––––––––––––––––––––––––––––––––––––––––––––––––––––––––––––––––––––––––––––––––––––––––––––––––––––––––––––––––––––––––––––––––-
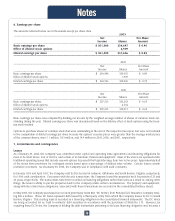
13. Quarterly financial data (unaudited)
The following is selected unaudited quarterly financial data for the fiscal years ended January 30, 2004 and January 31, 2003. Each
quarter listed below was a 13-week accounting period. Amounts are in thousands except per share data.
Quarter First Second Third Fourth
–––––––––––––––––––––––––––––––––––––––––––––––––––––––––––––––––––––––––––––––––––––––––––––––––––––––––––––––––––––––––––––––––––––––––––––––––––––––––––––––––––––––-
2003:
Net sales $ 1,569,064 $ 1,651,094 $ 1,685,346 $ 1,966,488
Gross profit 451,906 472,830 516,897 576,496
Net income 60,332 59,936 77,903 102,829
Diluted earnings per share $ 0.18 $ 0.18 $ 0.23 $ 0.30
Basic earnings per share $ 0.18 $ 0.18 $ 0.23 $ 0.31
2002:
Net sales $ 1,389,412 $ 1,453,727 $ 1,497,702 $ 1,759,563
Gross profit 380,292 387,427 428,583 527,964
Net income 45,928 42,362 68,570 108,086
Diluted earnings per share $ 0.14 $ 0.13 $ 0.20 $ 0.32
Basic earnings per share $ 0.14 $ 0.13 $ 0.21 $ 0.32
The fourth quarter 2003 net income and related per share amounts above include the accrual of a nondeductible civil penalty of $10.0
million related to the preliminary settlement of an SEC investigation (see Note 7). The fourth quarter 2003 and 2002 gross profit and
Notes
41