Dollar General 2003 Annual Report Download - page 44
Download and view the complete annual report
Please find page 44 of the 2003 Dollar General annual report below. You can navigate through the pages in the report by either clicking on the pages listed below, or by using the keyword search tool below to find specific information within the annual report.-
 1
1 -
2
-
3
-
4
-
5
-
6
-
7
-
8
-
9
-
10
-
11
-
12
-
13
-
14
-
15
-
16
-
17
-
18
-
19
-
20
-
21
-
22
-
23
-
24
-
25
-
26
-
27
-
28
-
29
-
30
-
31
-
32
-
33
-
 34
34 -
 35
35 -
 36
36 -
 37
37 -
 38
38 -
 39
39 -
 40
40 -
 41
41 -
 42
42 -
 43
43 -
 44
44 -
 45
45 -
 46
46 -
 47
47 -
 48
48 -
 49
49 -
 50
50 -
 51
51 -
 52
52 -
 53
53 -
 54
54
 |
 |

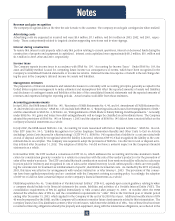
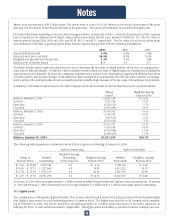
net income and related per share amounts above include pretax LIFO adjustments of $0.7 million of expense and $8.9 million of
income, respectively (see Note 1). The third quarter 2003 net income and related per share amounts above include a favorable, non-
recurring pre-tax inventory adjustment of approximately $7.8 million based upon the utilization of information provided by the
Company’s new item level perpetual inventory system. The third quarter 2002 net income and related per share amounts above
include pretax insurance proceeds of $25.2 million related to the settlement of the Company’s shareholder derivative litigation (see
Note 7). The second quarter 2002 net income and related per share amounts above include pretax insurance proceeds of $4.5 mil-
lion related to the settlement of the Company’s federal consolidated restatement-related class action lawsuit (see Note 7).
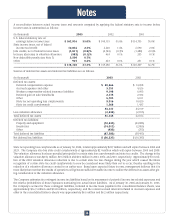
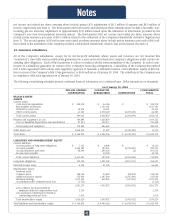
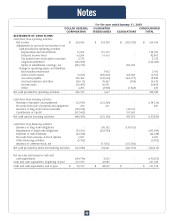
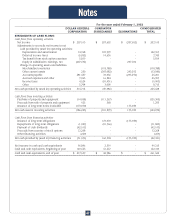
14. Guarantor subsidiaries
All of the Company’s subsidiaries, except for its not-for-profit subsidiary whose assets and revenues are not material (the
"Guarantors"), have fully and unconditionally guaranteed on a joint and several basis the Company’s obligations under certain out-
standing debt obligations. Each of the Guarantors is a direct or indirect wholly owned subsidiary of the Company. In order to par-
ticipate as a subsidiary guarantor on certain of the Company’s financing arrangements, a subsidiary of the Company has entered
into a letter agreement with certain state regulatory agencies to maintain a minimum balance of stockholders’ equity of $50 mil-
lion in excess of the Company’s debt it has guaranteed, or $550 million as of January 30, 2004. The subsidiary of the Company was
in compliance with such agreement as of January 30, 2004.
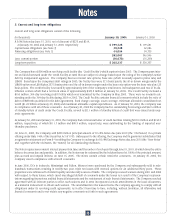
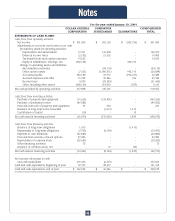
The following consolidating schedules present condensed financial information on a combined basis. Dollar amounts are in thousands.
As of January 30, 2004
––––––––––––––––––––––––––––––––––––––––––––––––––––––––––––––––––––––––––––––––––––––––––––––––––––––––––––––––––––––––––––––––––––––––––––––––––––––––––--------------------------–––––––––––––-
DOLLAR GENERAL GUARANTOR CONSOLIDATED
CORPORATION SUBSIDIARIES ELIMINATIONS TOTAL
––––––––––––––––––––––––––––––––––––––––––––––––––––––––––––––––––––––––––––––––––––––––––––––––––––––––––––––––––––––––––––––––––––––––––––––––––––––––––--------------------------–––––––––––––-
BALANCE SHEET:
ASSETS
Current assets:
Cash and cash equivalents $ 352,232 $ 46,046 $ - $ 398,278
Merchandise inventories - 1,157,141 - 1,157,141
Deferred income taxes 15,412 15,001 - 30,413
Other current assets 21,363 2,338,669 (2,293,649) 66,383
––––––––––––––––––––––––––––––––––––––––––––––––––––––––––––––––––––––––––––––––---------------------------–––––––––––––––––––––––––––––––––––––––––––––––––––––––––––––––––––––––––––––––––––––––
Total current assets 389,007 3,556,857 (2,293,649) 1,652,215
––––––––––––––––––––––––––––––––––––––––––––––––––––––––––––––––––––––––––––––––---------------------------–––––––––––––––––––––––––––––––––––––––––––––––––––––––––––––––––––––––––––––––––––––––
Property and equipment, at cost 183,843 1,525,879 - 1,709,722
Less accumulated depreciation and amortizationnd amortizat81,281 639,217 - 720,498
––––––––––––––––––––––––––––––––––––––––––––––––––––––––––––––––––––––––––––––––---------------------------–––––––––––––––––––––––––––––––––––––––––––––––––––––––––––––––––––––––––––––––––––––––
Net property and equipment 102,562 886,662 - 989,224
––––––––––––––––––––––––––––––––––––––––––––––––––––––––––––––––––––––––––––––––---------------------------–––––––––––––––––––––––––––––––––––––––––––––––––––––––––––––––––––––––––––––––––––––––
Other assets, net 3,695,306 41,247 (3,725,283) 11,270
––––––––––––––––––––––––––––––––––––––––––––––––––––––––––––––––––––––––––––––––---------------------------–––––––––––––––––––––––––––––––––––––––––––––––––––––––––––––––––––––––––––––––––––––––
Total assets $ 4,186,875 $ 4,484,766 $ (6,018,932) $ 2,652,709
––––––––––––––––––––––––––––––––––––––––––––––––––––––––––––––––––––––––––––––––---------------------------–––––––––––––––––––––––––––––––––––––––––––––––––––––––––––––––––––––––––––––––––––––––
––––––––––––––––––––––––––––––––––––––––––––––––––––––––––––––––––––––––––––––––---------------------------–––––––––––––––––––––––––––––––––––––––––––––––––––––––––––––––––––––––––––––––––––––––
LIABILITIES AND SHAREHOLDERS’ EQUITY
Current liabilities:
Current portion of long-term obligations $ 7,772 $ 8,898 $ - $ 16,670
Accounts payable 2,354,187 323,251 (2,293,647) 383,791
Accrued expenses and other 48,394 249,224 (2) 297,616
Income taxes payable - 45,725 - 45,725
––––––––––––––––––––––––––––––––––––––––––––––––––––––––––––––––––––––––––––––––---------------------------–––––––––––––––––––––––––––––––––––––––––––––––––––––––––––––––––––––––––––––––––––––––
Total current liabilities 2,410,353 627,098 (2,293,649) 743,802
––––––––––––––––––––––––––––––––––––––––––––––––––––––––––––––––––––––––––––––––---------------------------–––––––––––––––––––––––––––––––––––––––––––––––––––––––––––––––––––––––––––––––––––––––
Long-term obligations 194,306 1,892,342 (1,821,311) 265,337
––––––––––––––––––––––––––––––––––––––––––––––––––––––––––––––––––––––––––––––––---------------------------–––––––––––––––––––––––––––––––––––––––––––––––––––––––––––––––––––––––––––––––––––––––
Deferred income taxes 5,296 61,354 - 66,650
––––––––––––––––––––––––––––––––––––––––––––––––––––––––––––––––––––––––––––––––---------------------------–––––––––––––––––––––––––––––––––––––––––––––––––––––––––––––––––––––––––––––––––––––––
Shareholders’ equity:
Preferred stock - - - -
Common stock 168,095 23,853 (23,853) 168,095
Additional paid-in capital 376,930 1,247,290 (1,247,290) 376,930
Retained earnings 1,037,409 632,829 (632,829) 1,037,409
Accumulated other comprehensive loss (1,161) - - (1,161)
––––––––––––––––––––––––––––––––––––––––––––––––––––––––––––––––––––––––––––––––---------------------------–––––––––––––––––––––––––––––––––––––––––––––––––––––––––––––––––––––––––––––––––––––––
1,581,273 1,903,972 (1,903,972) 1,581,273
Less common stock purchased by
employee deferred compensation trust 2,739 - - 2,739
Less unearned compensation related to
outstanding restricted stock 1,614 - - 1,614
––––––––––––––––––––––––––––––––––––––––––––––––––––––––––––––––––––––––––––––––---------------------------–––––––––––––––––––––––––––––––––––––––––––––––––––––––––––––––––––––––––––––––––––––––
Total shareholders’ equity 1,576,920 1,903,972 (1,903,972) 1,576,920
––––––––––––––––––––––––––––––––––––––––––––––––––––––––––––––––––––––––––––––––---------------------------–––––––––––––––––––––––––––––––––––––––––––––––––––––––––––––––––––––––––––––––––––––––
Total liabilities and shareholders’ equity $ 4,186,875 $ 4,484,766 $ (6,018,932) $ 2,652,709
––––––––––––––––––––––––––––––––––––––––––––––––––––––––––––––––––––––––––––––––---------------------------–––––––––––––––––––––––––––––––––––––––––––––––––––––––––––––––––––––––––––––––––––––––
––––––––––––––––––––––––––––––––––––––––––––––––––––––––––––––––––––––––––––––––---------------------------–––––––––––––––––––––––––––––––––––––––––––––––––––––––––––––––––––––––––––––––––––––––
Notes
42