Dollar General 2003 Annual Report Download - page 45
Download and view the complete annual report
Please find page 45 of the 2003 Dollar General annual report below. You can navigate through the pages in the report by either clicking on the pages listed below, or by using the keyword search tool below to find specific information within the annual report.-
 1
1 -
2
-
3
-
4
-
5
-
6
-
7
-
8
-
9
-
10
-
11
-
12
-
13
-
14
-
15
-
16
-
17
-
18
-
19
-
20
-
21
-
22
-
23
-
24
-
25
-
26
-
27
-
28
-
29
-
30
-
31
-
32
-
33
-
34
-
 35
35 -
 36
36 -
 37
37 -
 38
38 -
 39
39 -
 40
40 -
 41
41 -
 42
42 -
 43
43 -
 44
44 -
 45
45 -
 46
46 -
 47
47 -
 48
48 -
 49
49 -
 50
50 -
 51
51 -
 52
52 -
 53
53 -
 54
54
 |
 |

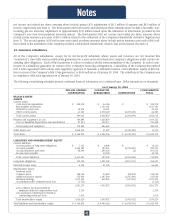
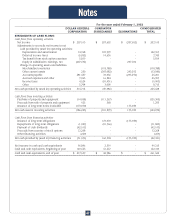
As of January 31, 2003
–––––––––––––––––––––––––––––––––––––––––––––––––––––––––––––––––––––––––––––––––––––––––––––––––––––––--------------------------––––––––––––––––––––––––––––––––––––––––––––––––––––––––––––––––-
DOLLAR GENERAL GUARANTOR CONSOLIDATED
CORPORATION SUBSIDIARIES ELIMINATIONS TOTAL
––––––––––––––––––––––––––––––––––––––––––––––––––––––––––––––––––––––––––––––––––––––––––––––––––––––––––––––––––––––––--------------------------–––––––––––––––––––––––––––––––––––––––––––––––-
BALANCE SHEET:
ASSETS
Current assets:
Cash and cash equivalents $ 72,799 $ 48,519 $ - $ 121,318
Merchandise inventories - 1,123,031 - 1,123,031
Deferred income taxes 8,937 24,923 - 33,860
Other current assets 19,004 1,328,417 (1,301,722) 45,699
––––––––––––––––––––––––––––––––––––––––––––––––––––––––––––––––––––––––––––––––---------------------------–––––––––––––––––––––––––––––––––––––––––––––––––––––––––––––––––––––––––––––––––––––––
Total current assets 100,740 2,524,890 (1,301,722) 1,323,908
––––––––––––––––––––––––––––––––––––––––––––––––––––––––––––––––––––––––––––––––---------------------------–––––––––––––––––––––––––––––––––––––––––––––––––––––––––––––––––––––––––––––––––––––––
Property and equipment, at cost 169,551 1,408,272 - 1,577,823
Less accumulated depreciation and amortization 65,677 518,324 - 584,001
––––––––––––––––––––––––––––––––––––––––––––––––––––––––––––––––––––––––––––––––---------------------------–––––––––––––––––––––––––––––––––––––––––––––––––––––––––––––––––––––––––––––––––––––––
Net property and equipment 103,874 889,948 - 993,822
––––––––––––––––––––––––––––––––––––––––––––––––––––––––––––––––––––––––––––––––---------------------------–––––––––––––––––––––––––––––––––––––––––––––––––––––––––––––––––––––––––––––––––––––––
Other assets, net 2,786,977 38,949 (2,810,503) 15,423
––––––––––––––––––––––––––––––––––––––––––––––––––––––––––––––––––––––––––––––––---------------------------–––––––––––––––––––––––––––––––––––––––––––––––––––––––––––––––––––––––––––––––––––––––
Total assets $ 2,991,591 $ 3,453,787 $ (4,112,225) $ 2,333,153
––––––––––––––––––––––––––––––––––––––––––––––––––––––––––––––––––––––––––––––––---------------------------–––––––––––––––––––––––––––––––––––––––––––––––––––––––––––––––––––––––––––––––––––––––
––––––––––––––––––––––––––––––––––––––––––––––––––––––––––––––––––––––––––––––––---------------------------–––––––––––––––––––––––––––––––––––––––––––––––––––––––––––––––––––––––––––––––––––––––
LIABILITIES AND SHAREHOLDERS’ EQUITY
Current liabilities:
Current portion of long-term obligations $ 8,202 $ 8,007 $ - $ 16,209
Accounts payable 1,412,008 230,273 (1,300,978) 341,303
Accrued expenses and other 32,642 208,000 (744) 239,898
Income taxes payable - 67,091 - 67,091
––––––––––––––––––––––––––––––––––––––––––––––––––––––––––––––––––––––––––––––––---------------------------–––––––––––––––––––––––––––––––––––––––––––––––––––––––––––––––––––––––––––––––––––––––
Total current liabilities 1,452,852 513,371 (1,301,722) 664,501
––––––––––––––––––––––––––––––––––––––––––––––––––––––––––––––––––––––––––––––––---------------------------–––––––––––––––––––––––––––––––––––––––––––––––––––––––––––––––––––––––––––––––––––––––
Long-term obligations 249,748 937,473 (856,884) 330,337
––––––––––––––––––––––––––––––––––––––––––––––––––––––––––––––––––––––––––––––––---------------------------–––––––––––––––––––––––––––––––––––––––––––––––––––––––––––––––––––––––––––––––––––––––
Deferred income taxes 923 49,324 - 50,247
––––––––––––––––––––––––––––––––––––––––––––––––––––––––––––––––––––––––––––––––---------------------------–––––––––––––––––––––––––––––––––––––––––––––––––––––––––––––––––––––––––––––––––––––––
Shareholders’ equity:
Preferred stock - - - -
Common stock 166,670 23,853 (23,853) 166,670
Additional paid-in capital 313,269 1,247,279 (1,247,279) 313,269
Retained earnings 812,220 682,487 (682,487) 812,220
Accumulated other comprehensive loss (1,349) - - (1,349)
––––––––––––––––––––––––––––––––––––––––––––––––––––––––––––––––––––––––––––––––---------------------------–––––––––––––––––––––––––––––––––––––––––––––––––––––––––––––––––––––––––––––––––––––––
1,290,810 1,953,619 (1,953,619) 1,290,810
Less common stock purchased by
employee deferred compensation trust 2,742 - - 2,742
––––––––––––––––––––––––––––––––––––––––––––––––––––––––––––––––––––––––––––––––---------------------------–––––––––––––––––––––––––––––––––––––––––––––––––––––––––––––––––––––––––––––––––––––––
Total shareholders’ equity 1,288,068 1,953,619 (1,953,619) 1,288,068
––––––––––––––––––––––––––––––––––––––––––––––––––––––––––––––––––––––––––––––––---------------------------–––––––––––––––––––––––––––––––––––––––––––––––––––––––––––––––––––––––––––––––––––––––
Total liabilities and shareholders’ equity $ 2,991,591 $ 3,453,787 $ (4,112,225) $ 2,333,153
––––––––––––––––––––––––––––––––––––––––––––––––––––––––––––––––––––––––––––––––---------------------------–––––––––––––––––––––––––––––––––––––––––––––––––––––––––––––––––––––––––––––––––––––––
––––––––––––––––––––––––––––––––––––––––––––––––––––––––––––––––––––––––––––––––---------------------------–––––––––––––––––––––––––––––––––––––––––––––––––––––––––––––––––––––––––––––––––––––––
Notes
43