Dollar General 2003 Annual Report Download - page 2
Download and view the complete annual report
Please find page 2 of the 2003 Dollar General annual report below. You can navigate through the pages in the report by either clicking on the pages listed below, or by using the keyword search tool below to find specific information within the annual report.-
 1
1 -
 2
2 -
 3
3 -
 4
4 -
 5
5 -
 6
6 -
 7
7 -
 8
8 -
 9
9 -
 10
10 -
 11
11 -
 12
12 -
 13
13 -
14
-
15
-
16
-
17
-
18
-
19
-
20
-
21
-
22
-
23
-
24
-
25
-
26
-
27
-
28
-
29
-
30
-
31
-
32
-
33
-
34
-
35
-
36
-
37
-
38
-
39
-
40
-
41
-
42
-
43
-
44
-
45
-
46
-
47
-
48
-
49
-
50
-
51
-
52
-
53
-
54
 |
 |

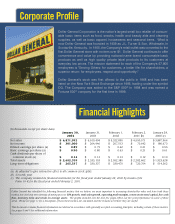
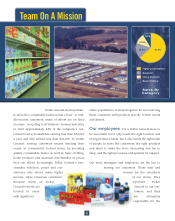
Dollar General Corporation is the nation's largest small box retailer of consum-
able basic items such as food, snacks, health and beauty aids and cleaning
supplies, as well as basic apparel, housewares and seasonal items. What is
now Dollar General was founded in 1939 as J.L. Turner & Son, Wholesale, in
Scottsville, Kentucky. In 1955, the Company's retail outlet was converted to the
first Dollar General store with no item over $1. Dollar General continues to offer
convenience and value by providing national name brand consumable basic
products as well as high quality private label products to its customers at
everyday low prices. The mission statement for each of the Company's 57,800
employees is "Serving Others: for customers, a better life; for shareholders, a
superior return; for employees, respect and opportunity."
Dollar General's stock was first offered to the public in 1968 and has been
listed on the New York Stock Exchange since 1995, trading under the symbol
DG. The Company was added to the S&P 500®in 1998 and was named a
Fortune 500®company for the first time in 1999.
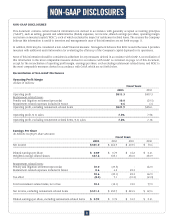
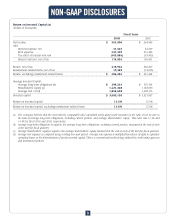
Corporate Profile
Financial Highlights
Dollar General has identified the following financial metrics that we believe are most important to increasing shareholder value and have built these
metrics into our long-term strategic planning process: EPS growth, total sales growth, operating profit margins, return on invested capital, free cash
flow, inventory turns and return on average assets. The graphs included over the next few pages reflect our five-year performance in some of these
areas. Please see page 11 for a description of how these metrics are calculated and the reasons we believe they are useful.
This document contains financial information not derived in accordance with generally accepted accounting principles, including certain of these metrics.
See pages 8 and 9 for additional information.
(In thousands except per share data)
January 30, January 31, February 1, February 2, January 28,
2004 2003 2002 2001 (b) 2000 (c)
_____________________________________________________________________________________________________________________________
Net sales $ 6,871,992 $ 6,100,404 $ 5,322,895 $ 4,550,571 $ 3,887,964
Net income $ 301,000 $ 264,946 $ 207,513 $ 70,642 $ 186,673
Diluted earnings per share (a) $0.89$ 0.79 $ 0.62 $ 0.21 $ 0.55
Basic earnings per share (a) $0.90$ 0.80 $ 0.63 $ 0.21 $ 0.61
Cash dividends per share of
common stock (a) $0.14$ 0.13 $ 0.13 $ 0.12 $ 0.10
Total assets $ 2,652,709 $ 2,333,153 $ 2,552,385 $ 2,282,462 $ 1,923,628
Long-term obligations $ 265,337 $ 330,337 $ 339,470 $ 720,764 $ 514,362
_____________________________________________________________________________________________________________________________
(a) As adjusted to give retroactive effect to all common stock splits.
(b) 53-week year.
(c) The Company restated its financial statements for the fiscal year ended January 28, 2000 by means of its
Form 10-K for the fiscal year ended February 2, 2001.