DIRECTV 2002 Annual Report Download - page 76
Download and view the complete annual report
Please find page 76 of the 2002 DIRECTV annual report below. You can navigate through the pages in the report by either clicking on the pages listed below, or by using the keyword search tool below to find specific information within the annual report.-
 1
1 -
2
-
3
-
4
-
5
-
6
-
7
-
8
-
9
-
10
-
11
-
12
-
13
-
14
-
15
-
16
-
17
-
18
-
19
-
20
-
21
-
22
-
23
-
24
-
25
-
26
-
27
-
28
-
29
-
30
-
31
-
32
-
33
-
34
-
35
-
36
-
37
-
38
-
39
-
40
-
41
-
42
-
43
-
44
-
45
-
46
-
47
-
48
-
49
-
50
-
51
-
52
-
53
-
54
-
55
-
56
-
57
-
58
-
59
-
60
-
61
-
62
-
63
-
64
-
65
-
 66
66 -
 67
67 -
 68
68 -
 69
69 -
 70
70 -
 71
71 -
 72
72 -
 73
73 -
 74
74 -
 75
75 -
 76
76 -
 77
77 -
 78
78 -
 79
79 -
 80
80 -
 81
81 -
 82
82 -
 83
83 -
 84
84 -
 85
85 -
 86
86 -
87
-
88
-
89
-
90
-
91
-
92
-
93
-
94
-
95
-
96
-
97
-
98
-
99
-
100
-
101
-
102
-
103
-
104
-
105
-
106
-
107
-
108
-
109
-
110
-
111
-
112
-
113
-
114
-
115
-
116
-
117
-
118
-
119
-
120
-
121
-
122
-
123
-
124
-
125
-
126
-
127
-
128
-
129
-
130
-
131
-
132
-
133
-
134
-
135
-
136
-
137
-
138
-
139
-
140
 |
 |

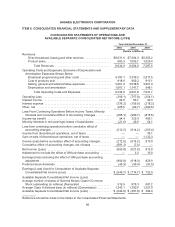
HUGHES ELECTRONICS CORPORATION
ITEM 8. CONSOLIDATED FINANCIAL STATEMENTS AND SUPPLEMENTARY DATA
CONSOLIDATED STATEMENTS OF OPERATIONS AND
AVAILABLE SEPARATE CONSOLIDATED NET INCOME (LOSS)
Years Ended December 31,
2002 2001 2000
(Dollars in Millions)
Revenues
Direct broadcast, leasing and other services ................. $8,031.0 $7,204.3 $6,262.2
Product sales ........................................... 903.9 1,059.7 1,025.4
Total Revenues ..................................... 8,934.9 8,264.0 7,287.6
Operating Costs and Expenses, Exclusive of Depreciation and
Amortization Expenses Shown Below
Broadcast programming and other costs ..................... 4,187.1 3,335.3 2,817.5
Cost of products sold .................................... 818.6 900.2 815.1
Selling, general and administrative expenses ................. 3,261.2 3,638.6 3,061.0
Depreciationandamortization ............................. 1,067.1 1,147.7 948.1
Total Operating Costs and Expenses ................... 9,334.0 9,021.8 7,641.7
Operating Loss ............................................. (399.1) (757.8) (354.1)
Interest income ............................................. 24.5 56.7 49.3
Interest expense ............................................ (336.2) (195.9) (218.2)
Other,net ................................................. 425.5 (92.7) (292.6)
Loss From Continuing Operations Before Income Taxes, Minority
Interests and Cumulative Effect of Accounting Changes .......... (285.3) (989.7) (815.6)
Income tax benefit .......................................... 94.4 325.6 406.1
Minority interests in net (earnings) losses of subsidiaries ........... (21.6) 49.9 54.1
Loss from continuing operations before cumulative effect of
accounting changes ....................................... (212.5) (614.2) (355.4)
Income from discontinued operations, net of taxes ................ — — 36.1
Gain on sale of discontinued operations, net of taxes .............. — — 1,132.3
Income (loss) before cumulative effect of accounting changes ....... (212.5) (614.2) 813.0
Cumulative effect of accounting changes, net of taxes ............. (681.3) (7.4) —
Net Income (Loss) .......................................... (893.8) (621.6) 813.0
Adjustment to exclude the effect of GM purchase accounting ....... — 3.3 16.9
Earnings (loss) excluding the effect of GM purchase accounting
adjustment ............................................... (893.8) (618.3) 829.9
Preferred stock dividends ..................................... (46.9) (96.4) (97.0)
Earnings (Loss) Used for Computation of Available Separate
Consolidated Net Income (Loss) ............................. $ (940.7) $ (714.7) $ 732.9
Available Separate Consolidated Net Income (Loss)
Average number of shares of General Motors Class H Common
Stock outstanding (in millions) (Numerator) .................... 919.5 876.3 681.2
Average Class H dividend base (in millions) (Denominator) ......... 1,343.1 1,300.0 1,297.0
Available Separate Consolidated Net Income (Loss) ............... $ (644.0) $ (481.8) $ 384.9
Reference should be made to the Notes to the Consolidated Financial Statements.
66