DIRECTV 2002 Annual Report Download - page 39
Download and view the complete annual report
Please find page 39 of the 2002 DIRECTV annual report below. You can navigate through the pages in the report by either clicking on the pages listed below, or by using the keyword search tool below to find specific information within the annual report.-
 1
1 -
2
-
3
-
4
-
5
-
6
-
7
-
8
-
9
-
10
-
11
-
12
-
13
-
14
-
15
-
16
-
17
-
18
-
19
-
20
-
21
-
22
-
23
-
24
-
25
-
26
-
27
-
28
-
 29
29 -
 30
30 -
 31
31 -
 32
32 -
 33
33 -
 34
34 -
 35
35 -
 36
36 -
 37
37 -
 38
38 -
 39
39 -
 40
40 -
 41
41 -
 42
42 -
 43
43 -
 44
44 -
 45
45 -
 46
46 -
 47
47 -
 48
48 -
 49
49 -
50
-
51
-
52
-
53
-
54
-
55
-
56
-
57
-
58
-
59
-
60
-
61
-
62
-
63
-
64
-
65
-
66
-
67
-
68
-
69
-
70
-
71
-
72
-
73
-
74
-
75
-
76
-
77
-
78
-
79
-
80
-
81
-
82
-
83
-
84
-
85
-
86
-
87
-
88
-
89
-
90
-
91
-
92
-
93
-
94
-
95
-
96
-
97
-
98
-
99
-
100
-
101
-
102
-
103
-
104
-
105
-
106
-
107
-
108
-
109
-
110
-
111
-
112
-
113
-
114
-
115
-
116
-
117
-
118
-
119
-
120
-
121
-
122
-
123
-
124
-
125
-
126
-
127
-
128
-
129
-
130
-
131
-
132
-
133
-
134
-
135
-
136
-
137
-
138
-
139
-
140
 |
 |

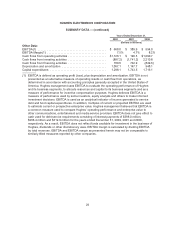
HUGHES ELECTRONICS CORPORATION
SUMMARY DATA — (continued)
Years Ended December 31,
2002 2001 2000
(Dollars in Millions)
Other Data:
EBITDA(1) ............................................. $ 668.0 $ 389.9 $ 594.0
EBITDAMargin(1) ....................................... 7.5% 4.7% 8.2%
Cash flows from operating activities ......................... $1,126.1 $ 190.3 $1,090.7
Cash flows from investing activities ......................... (887.2) (1,741.2) 2,210.8
Cash flows from financing activities ......................... 189.6 742.9 (849.6)
Depreciationandamortization ............................. 1,067.1 1,147.7 948.1
Capital expenditures ..................................... 1,298.1 1,743.5 1,716.1
(1) EBITDA is defined as operating profit (loss), plus depreciation and amortization. EBITDA is not
presented as an alternative measure of operating results or cash flow from operations, as
determined in accordance with accounting principles generally accepted in the United States of
America. Hughes management uses EBITDA to evaluate the operating performance of Hughes
and its business segments, to allocate resources and capital to its business segments and as a
measure of performance for incentive compensation purposes. Hughes believes EBITDA is a
measure of performance used by some investors, equity analysts and others to make informed
investment decisions. EBITDA is used as an analytical indicator of income generated to service
debt and fund capital expenditures. In addition, multiples of current or projected EBITDA are used
to estimate current or prospective enterprise value. Hughes management believes that EBITDA is
a common measure used to compare Hughes’ operating performance and enterprise value to
other communications, entertainment and media service providers. EBITDA does not give effect to
cash used for debt service requirements consisting of interest payments of $398.0 million,
$268.4 million and $312.9 million for the years ended December 31, 2002, 2001 and 2000,
respectively. As a result, EBITDA does not reflect funds available for investment in the business of
Hughes, dividends or other discretionary uses. EBITDA margin is calculated by dividing EBITDA
by total revenues. EBITDA and EBITDA margin as presented herein may not be comparable to
similarly titled measures reported by other companies.
29