DIRECTV 2002 Annual Report Download - page 114
Download and view the complete annual report
Please find page 114 of the 2002 DIRECTV annual report below. You can navigate through the pages in the report by either clicking on the pages listed below, or by using the keyword search tool below to find specific information within the annual report.-
 1
1 -
2
-
3
-
4
-
5
-
6
-
7
-
8
-
9
-
10
-
11
-
12
-
13
-
14
-
15
-
16
-
17
-
18
-
19
-
20
-
21
-
22
-
23
-
24
-
25
-
26
-
27
-
28
-
29
-
30
-
31
-
32
-
33
-
34
-
35
-
36
-
37
-
38
-
39
-
40
-
41
-
42
-
43
-
44
-
45
-
46
-
47
-
48
-
49
-
50
-
51
-
52
-
53
-
54
-
55
-
56
-
57
-
58
-
59
-
60
-
61
-
62
-
63
-
64
-
65
-
66
-
67
-
68
-
69
-
70
-
71
-
72
-
73
-
74
-
75
-
76
-
77
-
78
-
79
-
80
-
81
-
82
-
83
-
84
-
85
-
86
-
87
-
88
-
89
-
90
-
91
-
92
-
93
-
94
-
95
-
96
-
97
-
98
-
99
-
100
-
101
-
102
-
103
-
 104
104 -
 105
105 -
 106
106 -
 107
107 -
 108
108 -
 109
109 -
 110
110 -
 111
111 -
 112
112 -
 113
113 -
 114
114 -
 115
115 -
 116
116 -
 117
117 -
 118
118 -
 119
119 -
 120
120 -
 121
121 -
 122
122 -
 123
123 -
 124
124 -
125
-
126
-
127
-
128
-
129
-
130
-
131
-
132
-
133
-
134
-
135
-
136
-
137
-
138
-
139
-
140
 |
 |

HUGHES ELECTRONICS CORPORATION
NOTES TO THE CONSOLIDATED FINANCIAL STATEMENTS — (continued)
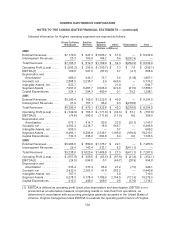
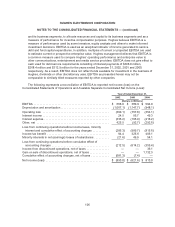
Selected information for Hughes’ operating segments are reported as follows:
Direct-To-Home
Broadcast
Satellite
Services
Network
Systems Other Eliminations Total
(Dollars in Millions)
2002
External Revenues ........ $7,170.0 $ 647.3 $1,065.7 $ 51.9 — $ 8,934.9
Intersegment Revenues .... 23.3 165.0 104.2 0.4 $(292.9) —
Total Revenues .......... $7,193.3 $ 812.3 $1,169.9 $ 52.3 $(292.9) $ 8,934.9
Operating Profit (Loss) ..... $ (505.2) $ 255.9 $ (160.7) $ 3.3 $ 7.6 $ (399.1)
EBITDA(1) .............. 160.8 591.6 (87.0) 6.7 (4.1) 668.0
Depreciation and
Amortization ........... 666.0 335.7 73.7 3.5 (11.8) 1,067.1
Goodwill, net ............. 2,888.5 2,238.7 2.4 645.6 — 5,775.2
Intangible Assets, net ..... 623.7 — — 21.0 — 644.7
Segment Assets .......... 7,957.2 6,487.7 2,526.9 974.8 (61.5) 17,885.1
Capital Expenditures ...... 524.1 294.3 400.4 0.1 79.2 1,298.1
2001
External Revenues ........ $6,285.4 $ 709.0 $1,229.6 $ 40.0 — $ 8,264.0
Intersegment Revenues .... 21.0 161.1 96.2 0.3 $(278.6) —
Total Revenues .......... $6,306.4 $ 870.1 $1,325.8 $ 40.3 $(278.6) $ 8,264.0
Operating Profit (Loss) ..... $ (749.9) $ 165.3 $ (171.8) $ (34.5) $ 33.1 $ (757.8)
EBITDA(1) .............. (74.8) 580.0 (111.8) (11.5) 8.0 389.9
Depreciation and
Amortization ........... 675.1 414.7 60.0 23.0 (25.1) 1,147.7
Goodwill, net ............. 3,593.3 2,238.7 18.9 645.7 — 6,496.6
Intangible Assets, net ..... 656.5 — — 3.7 — 660.2
Segment Assets .......... 9,484.1 6,296.8 2,339.1 1,199.0 (108.9) 19,210.1
Capital Expenditures ...... 734.3 338.2 664.6 0.4 6.0 1,743.5
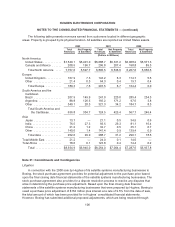
2000
External Revenues ........ $5,208.6 $ 880.2 $1,176.7 $ 22.1 — $ 7,287.6
Intersegment Revenues .... 29.4 143.4 233.1 5.2 $(411.1) —
Total Revenues .......... $5,238.0 $1,023.6 $1,409.8 $ 27.3 $(411.1) $ 7,287.6
Operating Profit (Loss) ..... $ (557.9) $ 356.6 $ (63.5) $ (67.9) $ (21.4) $ (354.1)
EBITDA(1) .............. (24.5) 694.0 0.1 (46.7) (28.9) 594.0
Depreciation and
Amortization ........... 533.4 337.4 63.6 21.2 (7.5) 948.1
Goodwill, net ............. 3,432.4 2,303.6 41.6 663.2 — 6,440.8
Intangible Assets, net ..... 707.5 — — 3.0 — 710.5
Segment Assets .......... 9,278.3 6,178.4 1,789.9 2,154.0 (121.3) 19,279.3
Capital Expenditures ...... 913.5 449.5 369.5 0.6 (17.0) 1,716.1
(1) EBITDA is defined as operating profit (loss), plus depreciation and amortization. EBITDA is not
presented as an alternative measure of operating results or cash flow from operations, as
determined in accordance with accounting principles generally accepted in the United States of
America. Hughes management uses EBITDA to evaluate the operating performance of Hughes
104