Costco 2008 Annual Report Download - page 86
Download and view the complete annual report
Please find page 86 of the 2008 Costco annual report below. You can navigate through the pages in the report by either clicking on the pages listed below, or by using the keyword search tool below to find specific information within the annual report.-
 1
1 -
2
-
3
-
4
-
5
-
6
-
7
-
8
-
9
-
10
-
11
-
12
-
13
-
14
-
15
-
16
-
17
-
18
-
19
-
20
-
21
-
22
-
23
-
24
-
25
-
26
-
27
-
28
-
29
-
30
-
31
-
32
-
33
-
34
-
35
-
36
-
37
-
38
-
39
-
40
-
41
-
42
-
43
-
44
-
45
-
46
-
47
-
48
-
49
-
50
-
51
-
52
-
53
-
54
-
55
-
56
-
57
-
58
-
59
-
60
-
61
-
62
-
63
-
64
-
65
-
66
-
67
-
68
-
69
-
70
-
71
-
72
-
73
-
74
-
75
-
 76
76 -
 77
77 -
 78
78 -
 79
79 -
 80
80 -
 81
81 -
 82
82 -
 83
83 -
 84
84 -
 85
85 -
 86
86 -
 87
87 -
 88
88 -
 89
89 -
 90
90 -
 91
91 -
 92
92
 |
 |

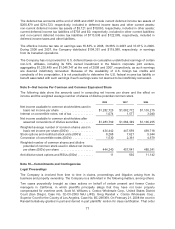
The accounting policies of the segments are the same as those described in Note 1. All inter-segment net
sales and expenses are immaterial and have been eliminated in computing total revenue and operating
income.
(a) Certain Home Office operating expenses are incurred on behalf of our Canadian operations, but are
included in the United States operations above as those costs are not allocated internally and generally
come under the responsibility of our United States management team.
(b) Includes a $39,200 charge related to protecting employees from adverse tax consequences resulting
from the Company’s internal review of its historical stock option grant practices in 2006 of certain stock
options (See Note 6).
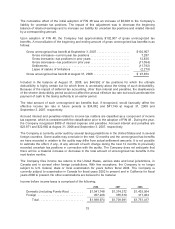
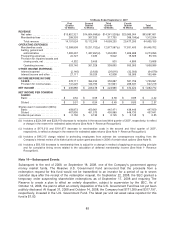
Note 13—Quarterly Financial Data (Unaudited)
The two tables that follow reflect the unaudited quarterly results of operations for 2008 and 2007.
52 Weeks Ended August 31, 2008
First
Quarter
12 Weeks
Second
Quarter
12 Weeks
Third
Quarter
12 Weeks
Fourth
Quarter
16 Weeks
Total
52 Weeks
REVENUE
Net sales ..................... $15,471,500 $16,616,962 $16,262,793 $22,626,229 $70,977,484
Membership fees .............. 338,030 342,924 350,924 473,658 1,505,536
Total revenue ............... 15,809,530 16,959,886 16,613,717 23,099,887 72,483,020
OPERATING EXPENSES
Merchandise costs ............. 13,823,511 14,833,189 14,548,022 20,298,028(a) 63,502,750
Selling, general and
administrative ............... 1,569,594 1,615,531 1,582,488 2,186,191 6,953,804
Preopening expenses .......... 21,492 9,699 8,427 17,765 57,383
Provision for impaired assets and
closing costs, net ............ 79 (2,865) 9,205 (6,171) 248
Operating income ............ 394,854 504,332 465,575 604,074 1,968,835
OTHER INCOME (EXPENSE)
Interest expense ............... (22,968) (23,471) (24,140) (32,057) (102,636)
Interest income and other ....... 33,277 40,604 23,888 35,006 132,775
INCOME BEFORE INCOME
TAXES ...................... 405,163 521,465 465,323 607,023 1,998,974
Provision for income taxes ...... 143,182 193,615 170,257 209,195 716,249
NET INCOME ................... $ 261,981 $ 327,850 $ 295,066 $ 397,828 $ 1,282,725
NET INCOME PER COMMON
SHARE:
Basic ........................ $ 0.60 $ 0.75 $ 0.68 $ 0.92 $ 2.95
Diluted ....................... $ 0.59 $ 0.74 $ 0.67 $ 0.90 $ 2.89
Shares used in calculation (000’s)
Basic ........................ 435,090 434,779 433,678 434,282 434,442
Diluted ....................... 445,717 444,925 443,281 443,874 444,240
Dividends per share .............. $ 0.145 $ 0.145 $ 0.160 $ 0.160 $ 0.61
(a) Includes a $32,316 increase to merchandise costs for a LIFO inventory adjustment (See Note 1- Merchandise
Inventories).
84