Costco 2008 Annual Report Download - page 62
Download and view the complete annual report
Please find page 62 of the 2008 Costco annual report below. You can navigate through the pages in the report by either clicking on the pages listed below, or by using the keyword search tool below to find specific information within the annual report.-
 1
1 -
2
-
3
-
4
-
5
-
6
-
7
-
8
-
9
-
10
-
11
-
12
-
13
-
14
-
15
-
16
-
17
-
18
-
19
-
20
-
21
-
22
-
23
-
24
-
25
-
26
-
27
-
28
-
29
-
30
-
31
-
32
-
33
-
34
-
35
-
36
-
37
-
38
-
39
-
40
-
41
-
42
-
43
-
44
-
45
-
46
-
47
-
48
-
49
-
50
-
51
-
 52
52 -
 53
53 -
 54
54 -
 55
55 -
 56
56 -
 57
57 -
 58
58 -
 59
59 -
 60
60 -
 61
61 -
 62
62 -
 63
63 -
 64
64 -
 65
65 -
 66
66 -
 67
67 -
 68
68 -
 69
69 -
 70
70 -
 71
71 -
 72
72 -
73
-
74
-
75
-
76
-
77
-
78
-
79
-
80
-
81
-
82
-
83
-
84
-
85
-
86
-
87
-
88
-
89
-
90
-
91
-
92
 |
 |

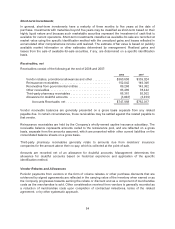
Fair Value of Financial Instruments
The carrying value of the Company’s financial instruments, including cash and cash equivalents,
receivables and accounts payable approximate fair value due to their short-term nature or variable
interest rates. Short-term investments classified as available-for-sale are recorded at market value with
unrealized gains or losses reflected in accumulated other comprehensive income. See Notes 2 and 3
for the fair value and carrying values of the Company’s short-term and long-term investments and fixed
rate debt, respectively.
Interest Income and Other
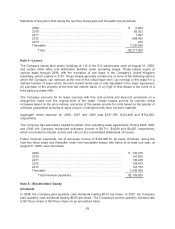
Interest income and other includes:
2008 2007 2006
Interest income ........................... $ 95,506 $128,413 $113,712
Earnings of affiliates ....................... 42,070 35,622 28,180
Minority interest and other .................. (4,801) 1,449 (3,537)
Interest income and other ............... $132,775 $165,484 $138,355
Income Taxes
The Company accounts for income taxes using the asset and liability method. Under the asset and
liability method, deferred tax assets and liabilities are recognized for the future tax consequences
attributed to differences between the financial statement carrying amounts of existing assets and
liabilities and their respective tax bases and tax credits and loss carry-forwards. Deferred tax assets
and liabilities are measured using enacted tax rates expected to apply to taxable income in the years in
which those temporary differences and carry-forwards are expected to be recovered or settled. The
effect on deferred tax assets and liabilities of a change in tax rates is recognized in income in the
period that includes the enactment date. A valuation allowance is established when necessary to
reduce deferred tax assets to amounts expected to be realized.
The Company accounts for unrecognized tax benefits in accordance with FASB Interpretation No. 48,
“Accounting for Uncertainty in Income Taxes, an Interpretation of FASB Statement No. 109” (FIN 48).
See Note 8 for further discussion.
Net Income per Common Share
The computation of basic net income per share is based on the weighted average number of shares
that were outstanding during the period. The computation of diluted net income per share is based on
the weighted average number of shares used in the basic net income per share calculation plus the
number of common shares that would be issued assuming exercise of all potentially dilutive common
shares outstanding using the treasury stock method for shares subject to stock options and restricted
stock units and the “if converted” method for the convertible note securities.
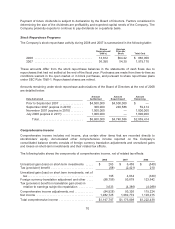
Stock Repurchase Programs
Shares repurchased are retired, in accordance with the Washington Business Corporation Act. The par
value of repurchased shares is deducted from common stock and the excess repurchase price over
par value is deducted from additional paid-in capital and retained earnings. See Note 5 for additional
information.
60