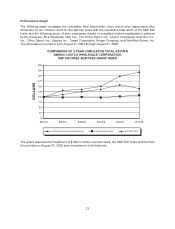
Costco 2008 Annual Report Download - page 27
Download and view the complete annual report
Please find page 27 of the 2008 Costco annual report below. You can navigate through the pages in the report by either clicking on the pages listed below, or by using the keyword search tool below to find specific information within the annual report.-
 1
1 -
2
-
3
-
4
-
5
-
6
-
7
-
8
-
9
-
10
-
11
-
12
-
13
-
14
-
15
-
16
-
 17
17 -
 18
18 -
 19
19 -
 20
20 -
 21
21 -
 22
22 -
 23
23 -
 24
24 -
 25
25 -
 26
26 -
 27
27 -
 28
28 -
 29
29 -
 30
30 -
 31
31 -
 32
32 -
 33
33 -
 34
34 -
 35
35 -
 36
36 -
 37
37 -
38
-
39
-
40
-
41
-
42
-
43
-
44
-
45
-
46
-
47
-
48
-
49
-
50
-
51
-
52
-
53
-
54
-
55
-
56
-
57
-
58
-
59
-
60
-
61
-
62
-
63
-
64
-
65
-
66
-
67
-
68
-
69
-
70
-
71
-
72
-
73
-
74
-
75
-
76
-
77
-
78
-
79
-
80
-
81
-
82
-
83
-
84
-
85
-
86
-
87
-
88
-
89
-
90
-
91
-
92
 |
 |
MANAGEMENT’S DISCUSSION AND ANALYSIS OF FINANCIAL CONDITION
AND RESULTS OF OPERATIONS
Overview
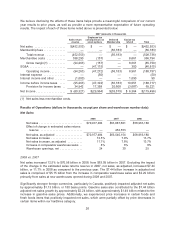
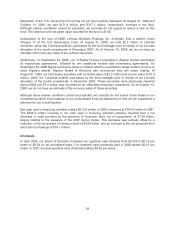
Our fiscal year ends on the Sunday closest to August 31. References to 2008 and 2007 relate to the
52-week years ended August 31, 2008 and September 2, 2007, respectively. References to 2006
relate to the 53-week year ended September 3, 2006.
Key items for 2008 included:
• Net sales increased 12.5% over 2007, driven by an 8% increase in comparable sales (sales
in warehouses open for at least one year) and the opening of 24 new warehouses (34
opened and 10 closed due to relocations) in 2008;
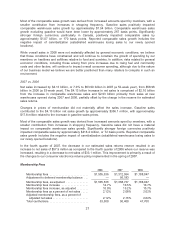
• Membership fees increased 14.7%, to $1.51 billion, primarily due to new membership
sign-ups at warehouses opened in 2008 and increased penetration of our higher-fee
Executive Membership program;
• Gross margin (net sales less merchandise costs) as a percentage of net sales increased one
basis point over the prior year, which included a $32.3 million LIFO charge, resulting from
increases in the cost of certain food items and gasoline;
• Selling, general and administrative (SG&A) expenses as a percentage of net sales
decreased 14 basis points over the prior year;
• Net income increased 18.5% to $1.28 billion, or $2.89 per diluted share, in 2008 compared to
$1.08 billion, or $2.37 per diluted share, in 2007;
• The Board of Directors approved an increase in the quarterly cash dividend from $0.145 to
$0.16 per share in April 2008; and
• We repurchased 13.8 million shares of our common stock, at an average cost of $64.22 per
share, totaling approximately $886.9 million.
As previously reported, 2007 was impacted by the following unusual items, the effects of which are
reflected in the table below:
• Sales returns reserve: We revised our estimate of our sales returns reserve to include a
longer timeframe for returns, as well as a lower realization rate on certain returned items.
• Employee tax consequences on stock options: We made payments to employees in
connection with changes in exercise prices designed to avoid adverse tax consequences for
employees and recorded a charge for the estimated amount to remedy adverse tax
consequences related to stock options held and previously exercised by employees outside
the United States.
• Excise tax refund: We received a refund related to 2002 through 2006, as a result of a
settlement with the U.S. Internal Revenue Service relating to excise taxes previously paid.
• Deferred membership: We analyzed the timing of recognition of membership fees, resulting
in a reduction to membership fee revenue and a corresponding increase to deferred
membership fees on our consolidated balance sheet.
25