Costco 2008 Annual Report Download - page 65
Download and view the complete annual report
Please find page 65 of the 2008 Costco annual report below. You can navigate through the pages in the report by either clicking on the pages listed below, or by using the keyword search tool below to find specific information within the annual report.-
 1
1 -
2
-
3
-
4
-
5
-
6
-
7
-
8
-
9
-
10
-
11
-
12
-
13
-
14
-
15
-
16
-
17
-
18
-
19
-
20
-
21
-
22
-
23
-
24
-
25
-
26
-
27
-
28
-
29
-
30
-
31
-
32
-
33
-
34
-
35
-
36
-
37
-
38
-
39
-
40
-
41
-
42
-
43
-
44
-
45
-
46
-
47
-
48
-
49
-
50
-
51
-
52
-
53
-
54
-
 55
55 -
 56
56 -
 57
57 -
 58
58 -
 59
59 -
 60
60 -
 61
61 -
 62
62 -
 63
63 -
 64
64 -
 65
65 -
 66
66 -
 67
67 -
 68
68 -
 69
69 -
 70
70 -
 71
71 -
 72
72 -
 73
73 -
 74
74 -
 75
75 -
76
-
77
-
78
-
79
-
80
-
81
-
82
-
83
-
84
-
85
-
86
-
87
-
88
-
89
-
90
-
91
-
92
 |
 |

2007: Cost Basis
Unrealized
Gains
Unrealized
Losses
Recorded
Basis
Balance Sheet
Classification
Short-term
Investments
Other
Assets
Available-for-sale:
Money market mutual
funds ................. $ 5,931 $ 7 $ — $ 5,938 $ 5,938 $—
U.S. Government and
agency securities ....... 268,886 552 (954) 268,484 268,484 —
Corporate notes and
bonds ................. 150,811 303 (1,070) 150,044 150,044 —
Asset and mortgage backed
securities .............. 72,919 209 (370) 72,758 72,758 —
Total
available-for-sale .... 498,547 1,071 (2,394) 497,224 497,224 —
Held-to-maturity:
Certificates of deposit ...... 78,247 — — 78,247 78,247 —
Money market mutual
funds ................. 316 — — 316 316 —
Total held-to-maturity . . 78,563 — — 78,563 78,563 —
Total investments .... $577,110 $1,071 $(2,394) $575,787 $575,787 $—
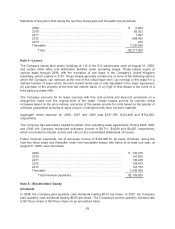
For available-for-sale securities, proceeds from sales were $164,959, $496,192, and $263,288 in 2008,
2007 and 2006, respectively. Gross realized gains from sales were $2,189, $933 and $170 in 2008,
2007 and 2006, respectively, and gross realized losses from sales were $471, $1,285 and $1,252 in
2008, 2007 and 2006, respectively.
The following tables present the length of time available-for-sale securities were in continuous
unrealized loss positions, but were not deemed to be other-than-temporarily impaired:
August 31, 2008
Less than 12 Months
Greater than or Equal
to 12 Months
Gross
Unrealized
Holding
Losses Fair Value
Gross
Unrealized
Holding
Losses Fair Value
U.S. government and agency securities ......... $ (772) $187,337 $ — $ —
Corporate notes and bonds ................... (1,045) 61,295 (8) 884
Asset and mortgage backed securities .......... (2,242) 57,607 (118) 3,138
$(4,059) $306,239 $ (126) $ 4,022
September 2, 2007
U.S. government and agency securities ......... $ (49) $ 30,572 $ (905) $175,765
Corporate notes and bonds ................... (128) 15,302 (942) 106,460
Asset and mortgage backed securities .......... (112) 20,081 (258) 20,014
$ (289) $ 65,955 $(2,105) $302,239
Gross unrealized holding losses of $4,059 for investments held less than twelve months and $126 for
investments held greater than or equal to twelve months as of August 31, 2008, pertain to 213 and 7
fixed income securities, respectively, and were primarily attributable to depressed market prices
resulting from lack of liquidity and changes in interest rates.
63