Costco 2008 Annual Report Download - page 75
Download and view the complete annual report
Please find page 75 of the 2008 Costco annual report below. You can navigate through the pages in the report by either clicking on the pages listed below, or by using the keyword search tool below to find specific information within the annual report.-
 1
1 -
2
-
3
-
4
-
5
-
6
-
7
-
8
-
9
-
10
-
11
-
12
-
13
-
14
-
15
-
16
-
17
-
18
-
19
-
20
-
21
-
22
-
23
-
24
-
25
-
26
-
27
-
28
-
29
-
30
-
31
-
32
-
33
-
34
-
35
-
36
-
37
-
38
-
39
-
40
-
41
-
42
-
43
-
44
-
45
-
46
-
47
-
48
-
49
-
50
-
51
-
52
-
53
-
54
-
55
-
56
-
57
-
58
-
59
-
60
-
61
-
62
-
63
-
64
-
 65
65 -
 66
66 -
 67
67 -
 68
68 -
 69
69 -
 70
70 -
 71
71 -
 72
72 -
 73
73 -
 74
74 -
 75
75 -
 76
76 -
 77
77 -
 78
78 -
 79
79 -
 80
80 -
 81
81 -
 82
82 -
 83
83 -
 84
84 -
 85
85 -
86
-
87
-
88
-
89
-
90
-
91
-
92
 |
 |

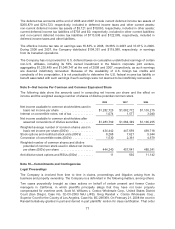
records. In connection with this review and guidance issued by the U.S. Internal Revenue Service on
November 30, 2006, the Compensation Committee of the Board of Directors approved a program
intended to protect approximately 1,000 Company employees who are United States taxpayers from
certain adverse tax consequences resulting from their options having been granted originally at prices
lower than the market value. The program involved increasing the exercise prices on certain stock
options granted from 2000 to 2003 and, in turn, the Company making payments to employees in an
amount approximately equal to the increase in the exercise price. As a result of this program, the
Company made cash payments totaling $18,735 to approximately 1,000 employees in the second
quarter of 2007, which resulted in a pre-tax stock compensation charge of $8,072 (“incremental fair
value”). The difference between the cash payment and the incremental fair value of $10,663 was
recognized as a reduction to additional paid-in capital, as it represented a partial cash settlement of the
original award because no future service was required to earn the cash payment.
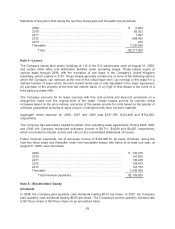
Also, in connection with the review, the Company has, among other things, recorded a liability for the
estimated payment the Company would make to compensate Canadian employees for the expected
disallowance of a tax deduction previously allowed for options exercised, primarily from calendar year
2004 through the end of 2008. During 2008, the Company made payments of approximately $38,424
to employees in Canada related to options exercised in calendar years 2004 through the end of
calendar year 2007. The related liability as of the end of 2008 and 2007 was $8,816 and $40,200,
respectively. The Company is examining alternatives to mitigate the potential adverse tax
consequences associated with unexercised options held by Canadian employees.
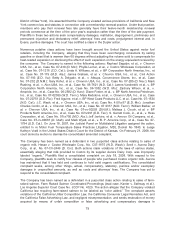
Summary of Restricted Stock Unit Activity
RSUs are granted to employees, which generally vest over five years and to non-employee directors,
which generally vest over three years; however, the Company provides for accelerated vesting upon
qualified retirement for recipients that have attained certain years of service with the Company.
Recipients are not entitled to vote or receive dividends on unvested shares. The fair value of RSUs is
the market value of the common stock on the date of grant less the present value of the expected
dividends forgone during the vesting period. At the end of 2008, 8.8 million RSUs were available to be
granted to eligible employees and directors under the Fourth Restated 2002 Plan.
The following awards were outstanding at the end of 2008:
• 6,208,500 shares of time-based RSUs in which the restrictions lapse upon the achievement of
continued employment over a specified period of time; and
• 496,500 performance RSUs, of which 305,000 were approved in the first quarter of 2008 and
will be formally granted to certain executive officers of the Company upon the achievement of
specified performance targets for 2008. Once formally granted, the restrictions lapse upon
achievement of continued employment over a specified period of time.
The following table summarizes RSU transactions during 2008:
Number of
Units
(in 000’s)
Weighted-Average
Grant Date
Fair Value
Non-vested at the end of 2007 .................... 4,779 $50.63
Granted ...................................... 3,058 64.73
Vested ....................................... (1,028) 50.71
Forfeited ...................................... (104) 55.38
Non-vested at the end of 2008 .................... 6,705 $ 56.97
73