Costco 2008 Annual Report Download - page 25
Download and view the complete annual report
Please find page 25 of the 2008 Costco annual report below. You can navigate through the pages in the report by either clicking on the pages listed below, or by using the keyword search tool below to find specific information within the annual report.-
 1
1 -
2
-
3
-
4
-
5
-
6
-
7
-
8
-
9
-
10
-
11
-
12
-
13
-
14
-
 15
15 -
 16
16 -
 17
17 -
 18
18 -
 19
19 -
 20
20 -
 21
21 -
 22
22 -
 23
23 -
 24
24 -
 25
25 -
 26
26 -
 27
27 -
 28
28 -
 29
29 -
 30
30 -
 31
31 -
 32
32 -
 33
33 -
 34
34 -
 35
35 -
36
-
37
-
38
-
39
-
40
-
41
-
42
-
43
-
44
-
45
-
46
-
47
-
48
-
49
-
50
-
51
-
52
-
53
-
54
-
55
-
56
-
57
-
58
-
59
-
60
-
61
-
62
-
63
-
64
-
65
-
66
-
67
-
68
-
69
-
70
-
71
-
72
-
73
-
74
-
75
-
76
-
77
-
78
-
79
-
80
-
81
-
82
-
83
-
84
-
85
-
86
-
87
-
88
-
89
-
90
-
91
-
92
 |
 |
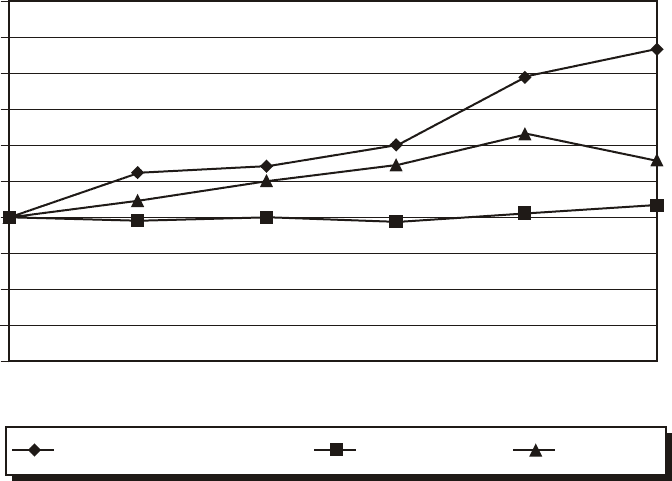
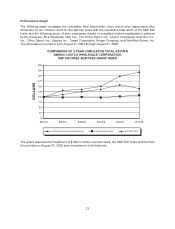
Performance Graph
The following graph compares the cumulative total shareholder return (stock price appreciation plus
dividends) on our common stock for the last five years with the cumulative total return of the S&P 500
Index and the following group of peer companies (based on weighted market capitalization) selected
by the Company: BJ’s Wholesale Club, Inc.; The Home Depot, Inc.; Lowe’s Companies; Best Buy Co.,
Inc.; Office Depot, Inc.; Staples Inc.; Target Corporation; Kroger Company; and Wal-Mart Stores, Inc.
The information provided is from August 31, 2003 through August 31, 2008.
COMPARISON OF 5-YEAR CUMULATIVE TOTAL RETURN
AMONG COSTCO WHOLESALE CORPORATION,
S&P 500 INDEX AND PEER GROUP INDEX
0
75
50
25
250
DOLLARS
COSTCO WHOLESALE CORPORATION PEER GROUP INDEX S&P 500 INDEX
125
100
175
150
225
200
8/31/03 8/29/04 8/28/05 9/03/06 9/02/07 8/31/08
The graph assumes the investment of $100 in Costco common stock, the S&P 500 Index and the Peer
Group Index on August 31, 2003 and reinvestment of all dividends.
23