Costco 2008 Annual Report Download - page 34
Download and view the complete annual report
Please find page 34 of the 2008 Costco annual report below. You can navigate through the pages in the report by either clicking on the pages listed below, or by using the keyword search tool below to find specific information within the annual report.-
 1
1 -
2
-
3
-
4
-
5
-
6
-
7
-
8
-
9
-
10
-
11
-
12
-
13
-
14
-
15
-
16
-
17
-
18
-
19
-
20
-
21
-
22
-
23
-
 24
24 -
 25
25 -
 26
26 -
 27
27 -
 28
28 -
 29
29 -
 30
30 -
 31
31 -
 32
32 -
 33
33 -
 34
34 -
 35
35 -
 36
36 -
 37
37 -
 38
38 -
 39
39 -
 40
40 -
 41
41 -
 42
42 -
 43
43 -
 44
44 -
45
-
46
-
47
-
48
-
49
-
50
-
51
-
52
-
53
-
54
-
55
-
56
-
57
-
58
-
59
-
60
-
61
-
62
-
63
-
64
-
65
-
66
-
67
-
68
-
69
-
70
-
71
-
72
-
73
-
74
-
75
-
76
-
77
-
78
-
79
-
80
-
81
-
82
-
83
-
84
-
85
-
86
-
87
-
88
-
89
-
90
-
91
-
92
 |
 |

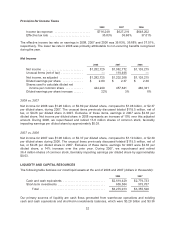
Provision for Income Taxes
2008 2007 2006
Income tax expense ....................... $716,249 $627,219 $648,202
Effective tax rate .......................... 35.83% 36.68% 37.01%
The effective income tax rate on earnings in 2008, 2007 and 2006 was 35.83%, 36.68% and 37.01%,
respectively. The lower tax rate in 2008 was primarily attributable to non-recurring benefits recognized
during the year.
Net Income
2008 2007 2006
Net income .......................... $1,282,725 $1,082,772 $1,103,215
Unusual items (net of tax) .............. — 119,496 —
Net income, as adjusted ............... $1,282,725 $1,202,268 $1,103,215
Diluted earnings per share ............. $ 2.89 $ 2.37 $ 2.30
Shares used to calculate diluted net
income per common share ........... 444,240 457,641 480,341
Diluted earnings per share increase ...... 22% 3% 6%
2008 vs. 2007
Net income for 2008 was $1.28 billion, or $2.89 per diluted share, compared to $1.08 billion, or $2.37
per diluted share, during 2007. The unusual items previously discussed totaled $119.5 million, net of
tax, or $0.26 per diluted share in 2007. Exclusive of these items, earnings in 2007 were $2.63 per
diluted share. Net income per diluted share in 2008 represents an increase of 10% over this adjusted
amount. During 2008, we repurchased and retired 13.8 million shares of common stock, favorably
impacting earnings per diluted share by approximately $0.03.
2007 vs. 2006
Net income for 2007 was $1.08 billion, or $2.37 per diluted share, compared to $1.10 billion, or $2.30
per diluted share during 2006. The unusual items previously discussed totaled $119.5 million, net of
tax, or $0.26 per diluted share in 2007. Exclusive of these items, earnings for 2007 were $2.63 per
diluted share, a 14% increase over the prior year. During 2007, we repurchased and retired
36.4 million shares of common stock, favorably impacting earnings per diluted share by approximately
$0.03.
LIQUIDITY AND CAPITAL RESOURCES
The following table itemizes our most liquid assets at the end of 2008 and 2007 (dollars in thousands):
2008 2007
Cash and cash equivalents ........................... $2,619,429 $2,779,733
Short-term investments .............................. 655,584 575,787
Total .......................................... $3,275,013 $3,355,520
Our primary sources of liquidity are cash flows generated from warehouse operations and existing
cash and cash equivalents and short-term investments balances, which were $3.28 billion and $3.36
32