Costco 2008 Annual Report Download - page 74
Download and view the complete annual report
Please find page 74 of the 2008 Costco annual report below. You can navigate through the pages in the report by either clicking on the pages listed below, or by using the keyword search tool below to find specific information within the annual report.
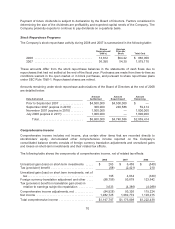
(1) The difference between the original exercise price and market value of common stock at
August 31, 2008.
(2) Stock options generally vest over five years and have a ten-year term.
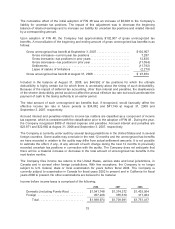
In 2006, the fair value of each option grant was estimated on the date of grant using the Black-Scholes
option-pricing model with the following weighted average assumptions:
2006
Expected volatility ........................................... 28%
Expected term .............................................. 5.2years
Risk free interest rate ........................................ 4.33%
Expected dividend yield ...................................... 0.99%
Weighted-average fair value per option granted ................... $13.87
In 2006, the expected volatility was based primarily on the historical volatility of the Company’s stock
and, to a lesser extent, the six-month implied volatility of its traded options. In 2006, the expected term
was the average of the life of all historical grants that have been exercised and the term at which the
historical average intrinsic gain is reached. The risk-free interest rate is based on the U.S. Treasury
yield curve in effect at the time of the grant with an equivalent remaining term. The expected dividend
yield is based on the annual dividend rate at the time of the grant.
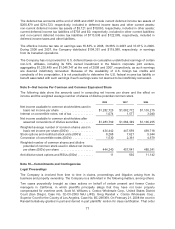
The following is a summary of stock options outstanding at the end of 2008 (number of options in
thousands):
Options Outstanding Options Exercisable
Range of Prices Number
Weighted
Average
Remaining
Contractual
Life
Weighted
Average
Exercise
Price Number
Weighted-
Average
Exercise
Price
$23.31–$36.91 ............ 5,429 3.28 $33.99 5,379 $34.00
$37.35–$39.25 ............ 5,630 4.95 37.89 4,287 38.06
$39.65–$43.00 ............ 1,680 2.08 42.22 1,680 42.22
$43.79–$52.50 ............ 8,655 5.86 44.80 4,389 45.29
21,394 4.67 $40.04 15,735 $39.14
At the end of 2007 and 2006, there were 19,283 and 22,289 options exercisable at weighted average
exercise prices of $38.35 and $35.92, respectively.
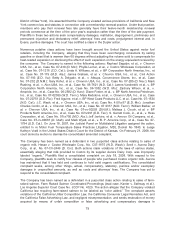
The tax benefit realized and intrinsic value related to total stock options exercised during 2008, 2007
and 2006 are provided in the following table:
2008 2007 2006
Actual tax benefit realized for stock options
exercised .............................. $ 85,610 $ 65,778 $ 80,417
Intrinsic value of stock options exercised(1) .... $262,168 $212,678 $240,211
(1) The difference between the original exercise price and market value of common stock measured
at each individual exercise date.
Employee Tax Consequences on Certain Stock Options
As previously disclosed, in 2006, a special committee of independent directors was formed to
determine whether the stated grant dates of options were supported by the Company’s books and
72


