Costco 2008 Annual Report Download - page 29
Download and view the complete annual report
Please find page 29 of the 2008 Costco annual report below. You can navigate through the pages in the report by either clicking on the pages listed below, or by using the keyword search tool below to find specific information within the annual report.-
 1
1 -
2
-
3
-
4
-
5
-
6
-
7
-
8
-
9
-
10
-
11
-
12
-
13
-
14
-
15
-
16
-
17
-
18
-
 19
19 -
 20
20 -
 21
21 -
 22
22 -
 23
23 -
 24
24 -
 25
25 -
 26
26 -
 27
27 -
 28
28 -
 29
29 -
 30
30 -
 31
31 -
 32
32 -
 33
33 -
 34
34 -
 35
35 -
 36
36 -
 37
37 -
 38
38 -
 39
39 -
40
-
41
-
42
-
43
-
44
-
45
-
46
-
47
-
48
-
49
-
50
-
51
-
52
-
53
-
54
-
55
-
56
-
57
-
58
-
59
-
60
-
61
-
62
-
63
-
64
-
65
-
66
-
67
-
68
-
69
-
70
-
71
-
72
-
73
-
74
-
75
-
76
-
77
-
78
-
79
-
80
-
81
-
82
-
83
-
84
-
85
-
86
-
87
-
88
-
89
-
90
-
91
-
92
 |
 |

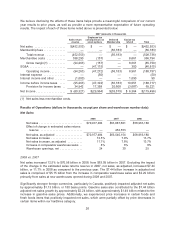
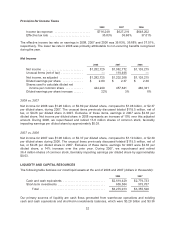
Most of the comparable sales growth was derived from increased amounts spent by members, with a
smaller contribution from increases in shopping frequency. Gasoline sales positively impacted
comparable warehouse sales growth by approximately $1.94 billion. Comparable warehouse sales
growth excluding gasoline would have been lower by approximately 267 basis points. Significantly
stronger foreign currencies, particularly in Canada, positively impacted comparable sales by
approximately $1.07 billion, or 170 basis points. Reported comparable sales growth includes the
negative impact of cannibalization (established warehouses losing sales to our newly opened
locations).
While overall sales in 2008 were not materially affected by general economic conditions, we believe
that those conditions have constrained and will continue to constrain the growth of spending by our
members on hardlines and softlines relative to food and sundries. In addition, risks related to general
economic conditions, including those arising from price increases due to rising fuel and commodity
costs and other factors, will continue to impact overall consumer spending, although due to the nature
of our business model we believe we are better positioned than many retailers to compete in such an
environment.
2007 vs. 2006
Net sales increased by $4.13 billion, or 7.0% to $63.09 billion in 2007 (a 52-week year), from $58.96
billion in 2006 (a 53-week year). The $4.13 billion increase in net sales is comprised of $2.10 billion
from the increase in comparable warehouse sales and $2.03 billion primarily from sales at new
warehouses opened during 2007 and 2006, partially offset by the change in the reserve for estimated
sales returns.
Changes in prices of merchandise did not materially affect the sales increase. Gasoline sales
contributed to the $4.13 billion net sales growth by approximately $356.1 million, with approximately
$17.8 million related to the increase in gasoline sales prices.
Most of the comparable sales growth was derived from increased amounts spent by members, with a
smaller contribution from increases in shopping frequency. Gasoline sales did not have a material
impact on comparable warehouse sales growth. Significantly stronger foreign currencies positively
impacted comparable sales by approximately $418.4 million, or 72 basis points. Reported comparable
sales growth includes the negative impact of cannibalization (established warehouses losing sales to
our newly opened locations).
In the fourth quarter of 2007, the decrease in our estimated sales returns reserve resulted in an
increase to net sales of $57.9 million as compared to the fourth quarter of 2006 where our reserve was
increased, resulting in a decrease to net sales of $33.1 million. This improvement is primarily a result of
the changes to our consumer electronics returns policy implemented in the spring of 2007.
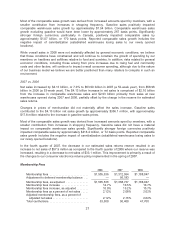
Membership Fees
2008 2007 2006
Membership fees .......................... $1,505,536 $1,312,554 $1,188,047
Adjustment to deferred membership balance . . . — 56,183 —
Membership fees, as adjusted ............... $1,505,536 $1,368,737 $1,188,047
Membership fees increase .................. 14.7% 10.5% 10.7%
Membership fees increase, as adjusted ........ 10.0% 15.2% 10.7%
Membership fees as a percent of net sales ..... 2.12% 2.08% 2.02%
Adjusted membership fees, as a percent of
adjusted net sales ........................ 2.12% 2.16% 2.02%
Total cardholders .......................... 53,500 50,400 47,700
27