Costco 2008 Annual Report Download - page 28
Download and view the complete annual report
Please find page 28 of the 2008 Costco annual report below. You can navigate through the pages in the report by either clicking on the pages listed below, or by using the keyword search tool below to find specific information within the annual report.-
 1
1 -
2
-
3
-
4
-
5
-
6
-
7
-
8
-
9
-
10
-
11
-
12
-
13
-
14
-
15
-
16
-
17
-
 18
18 -
 19
19 -
 20
20 -
 21
21 -
 22
22 -
 23
23 -
 24
24 -
 25
25 -
 26
26 -
 27
27 -
 28
28 -
 29
29 -
 30
30 -
 31
31 -
 32
32 -
 33
33 -
 34
34 -
 35
35 -
 36
36 -
 37
37 -
 38
38 -
39
-
40
-
41
-
42
-
43
-
44
-
45
-
46
-
47
-
48
-
49
-
50
-
51
-
52
-
53
-
54
-
55
-
56
-
57
-
58
-
59
-
60
-
61
-
62
-
63
-
64
-
65
-
66
-
67
-
68
-
69
-
70
-
71
-
72
-
73
-
74
-
75
-
76
-
77
-
78
-
79
-
80
-
81
-
82
-
83
-
84
-
85
-
86
-
87
-
88
-
89
-
90
-
91
-
92
 |
 |

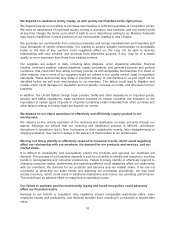
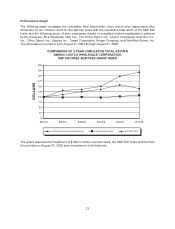
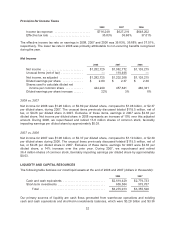
We believe disclosing the effects of these items helps provide a meaningful comparison of our current
year results to prior years, as well as provide a more representative expectation of future operating
results. The impact of each of these items noted above is presented below:
2007 (amounts in thousands)
Sales return
reserve
Employee tax
consequences on
stock options
Deferred
Membership
Excise tax
refund Total
Net sales .................... $(452,553) $ — $ — $ — $(452,553)
Membership fees .............. — — (56,183) — (56,183)
Total revenue ............. (452,553) — (56,183) — (508,736)
Merchandise costs ............ 358,290 (157) — 8,661 366,794
Gross margin(1) ........... (94,263) (157) — 8,661 (85,759)
SG&A ....................... — (47,115) — 300 (46,815)
Operating income .......... (94,263) (47,272) (56,183) 8,961 (188,757)
Interest expense .............. — (50) — — (50)
Interest income and other ....... (1,000) — — 1,090 90
Income before income taxes .... (95,263) (47,322) (56,183) 10,051 (188,717)
Provision for income taxes . . 34,942 17,358 20,608 (3,687) 69,221
Net Income ................... $ (60,321) $(29,964) $(35,575) $ 6,364 $(119,496)
(1) Net sales less merchandise costs.
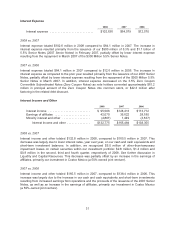
Results of Operations (dollars in thousands, except per share and warehouse number data)
Net Sales
2008 2007 2006
Net sales ............................. $70,977,484 $63,087,601 $58,963,180
Effect of change in estimated sales returns
reserve ............................ — 452,553 —
Net sales, as adjusted .................. $70,977,484 $63,540,154 $58,963,180
Net sales increase ..................... 12.5% 7.0% 13.7%
Net sales increase, as adjusted .......... 11.7% 7.8% 13.7%
Increase in comparable warehouse sales . . 8% 6% 8%
Warehouse openings, net ............... 24 30 25
2008 vs. 2007
Net sales increased 12.5% to $70.98 billion in 2008, from $63.09 billion in 2007. Excluding the impact
of the change in the estimated sales returns reserve in 2007, net sales, as adjusted, increased $7.44
billion, or 11.7% in 2008 as compared to the previous year. The $7.44 billion increase in adjusted net
sales is comprised of $5.15 billion from the increase in comparable warehouse sales and $2.29 billion
primarily from sales at new warehouses opened during 2008 and 2007.
Significantly stronger foreign currencies, particularly in Canada, positively impacted adjusted net sales
by approximately $1.13 billion, or 180 basis points. Gasoline sales also contributed to the $7.44 billion
adjusted net sales growth by approximately $2.24 billion, with approximately $1.49 billion related to the
increase in gasoline sales prices. Additionally, we experienced price increases in certain foods and
fresh foods items that positively impacted net sales, which were partially offset by price decreases in
certain items within our hardlines category.
26