Costco 2008 Annual Report Download - page 54
Download and view the complete annual report
Please find page 54 of the 2008 Costco annual report below. You can navigate through the pages in the report by either clicking on the pages listed below, or by using the keyword search tool below to find specific information within the annual report.-
 1
1 -
2
-
3
-
4
-
5
-
6
-
7
-
8
-
9
-
10
-
11
-
12
-
13
-
14
-
15
-
16
-
17
-
18
-
19
-
20
-
21
-
22
-
23
-
24
-
25
-
26
-
27
-
28
-
29
-
30
-
31
-
32
-
33
-
34
-
35
-
36
-
37
-
38
-
39
-
40
-
41
-
42
-
43
-
 44
44 -
 45
45 -
 46
46 -
 47
47 -
 48
48 -
 49
49 -
 50
50 -
 51
51 -
 52
52 -
 53
53 -
 54
54 -
 55
55 -
 56
56 -
 57
57 -
 58
58 -
 59
59 -
 60
60 -
 61
61 -
 62
62 -
 63
63 -
 64
64 -
65
-
66
-
67
-
68
-
69
-
70
-
71
-
72
-
73
-
74
-
75
-
76
-
77
-
78
-
79
-
80
-
81
-
82
-
83
-
84
-
85
-
86
-
87
-
88
-
89
-
90
-
91
-
92
 |
 |

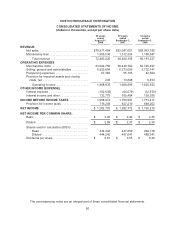
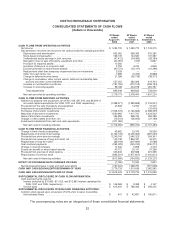
COSTCO WHOLESALE CORPORATION
CONSOLIDATED STATEMENTS OF CASH FLOWS
(dollars in thousands)
52 Weeks
ended
August 31,
2008
52 Weeks
ended
September 2,
2007
53 Weeks
ended
September 3,
2006
CASH FLOWS FROM OPERATING ACTIVITIES
Net income .......................................................... $1,282,725 $ 1,082,772 $ 1,103,215
Adjustments to reconcile net income to net cash provided by operating activities:
Depreciation and amortization ........................................ 653,082 566,385 515,285
Stock-based compensation .......................................... 166,105 134,582 107,397
Undistributed equity earnings in joint ventures ........................... (41,412) (34,080) (28,180)
Net (gain) / loss on sale of property, equipment and other ................. (22,067) (105) 5,867
Provision for impaired assets ......................................... 10,292 — —
Accretion of discount on long-term debt ................................ 2,752 3,074 4,828
Excess tax benefit on share based awards ............................. (40,772) (25,141) (31,296)
Realized and other than temporary impairment loss on investments ......... 5,033 — —
Other non-cash items, net ........................................... 7,699 (5,055) (5,888)
Change in deferred income taxes ..................................... 21,288 (92,739) (38,311)
Change in receivables, other current assets, deferred membership fees,
accrued and other current liabilities .................................. 227,052 284,306 414,704
Increase in merchandise inventories ................................... (191,792) (272,513) (499,194)
Increase in accounts payable ......................................... 96,188 434,918 282,797
Total adjustments ................................................ 893,448 993,632 728,009
Net cash provided by operating activities ............................... 2,176,173 2,076,404 1,831,224
CASH FLOWS FROM INVESTING ACTIVITIES
Additions to property and equipment, net of $21,429, $41,519, and $3,934 of
non-cash capital expenditures for 2008, 2007 and 2006, respectively ........ (1,598,571) (1,385,699) (1,216,501)
Proceeds from the sale of property and equipment ......................... 47,608 14,054 15,740
Investment in unconsolidated joint venture ................................ — — (15,000)
Purchases of short-term investments .................................... (1,506,776) (1,160,663) (2,598,355)
Maturities of short-term investments ..................................... 1,560,965 1,417,731 2,424,503
Sales of short-term investments ........................................ 164,959 496,192 263,288
Change in other assets and other, net ................................... (13,515) (36,925) (31,169)
Investments transferred from cash and cash equivalents .................... (371,062) — —
Net cash used in investing activities ................................... (1,716,392) (655,310) (1,157,494)
CASH FLOWS FROM FINANCING ACTIVITIES
Change in bank checks outstanding ..................................... 49,662 23,375 33,559
Repayments of short-term borrowings ................................... (5,163,105) (2,035,362) (567,230)
Proceeds from short-term borrowings .................................... 5,249,745 2,045,323 554,301
Proceeds from issuance of long-term debt, net ............................ 103,139 1,994,187 18,375
Repayments of long-term debt .......................................... (69,044) (307,894) (7,586)
Cash dividend payments .............................................. (265,029) (245,742) (230,211)
Change in minority interests ............................................ 12,540 5,959 4,744
Excess tax benefit on share based awards ............................... 40,772 25,141 31,296
Proceeds from exercise of stock options ................................. 323,632 307,988 372,336
Repurchases of common stock ......................................... (895,307) (1,977,607) (1,442,811)
Net cash used in financing activities ................................... (612,995) (164,632) (1,233,227)
EFFECT OF EXCHANGE RATE CHANGES ON CASH ...................... (7,090) 12,332 7,851
Net (decrease)/increase in cash and cash equivalents ...................... (160,304) 1,268,794 (551,646)
CASH AND CASH EQUIVALENTS BEGINNING OF YEAR ................... 2,779,733 1,510,939 2,062,585
CASH AND CASH EQUIVALENTS END OF YEAR ......................... $2,619,429 $ 2,779,733 $ 1,510,939
SUPPLEMENTAL DISCLOSURE OF CASH FLOW INFORMATION:
Cash paid during the year for:
Interest (reduced by $15,803, $11,423, and $12,681 interest capitalized for
2008, 2007 and 2006, respectively) .................................. $ 106,568 $ 9,369 $ 4,147
Income taxes ...................................................... $ 615,400 $ 786,283 $ 546,205
SUPPLEMENTAL DISCLOSURE OF NON-CASH FINANCING ACTIVITIES:
Common stock issued upon conversion of 3.5% Zero Coupon Convertible
Subordinated Notes ................................................ $ 401 $ 42,697 $ 190,871
The accompanying notes are an integral part of these consolidated financial statements.
52