Comcast 2007 Annual Report Download - page 74
Download and view the complete annual report
Please find page 74 of the 2007 Comcast annual report below. You can navigate through the pages in the report by either clicking on the pages listed below, or by using the keyword search tool below to find specific information within the annual report.-
 1
1 -
2
-
3
-
4
-
5
-
6
-
7
-
8
-
9
-
10
-
11
-
12
-
13
-
14
-
15
-
16
-
17
-
18
-
19
-
20
-
21
-
22
-
23
-
24
-
25
-
26
-
27
-
28
-
29
-
30
-
31
-
32
-
33
-
34
-
35
-
36
-
37
-
38
-
39
-
40
-
41
-
42
-
43
-
44
-
45
-
46
-
47
-
48
-
49
-
50
-
51
-
52
-
53
-
54
-
55
-
56
-
57
-
58
-
59
-
60
-
61
-
62
-
63
-
 64
64 -
 65
65 -
 66
66 -
 67
67 -
 68
68 -
 69
69 -
 70
70 -
 71
71 -
 72
72 -
 73
73 -
 74
74 -
 75
75 -
 76
76 -
 77
77 -
 78
78 -
 79
79 -
 80
80 -
 81
81 -
 82
82 -
 83
83 -
 84
84 -
85
-
86
-
87
-
88
 |
 |

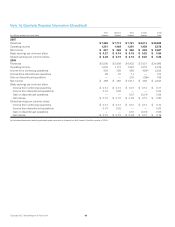
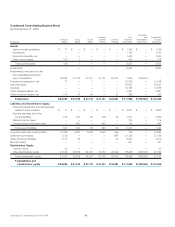
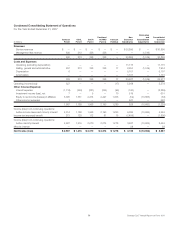
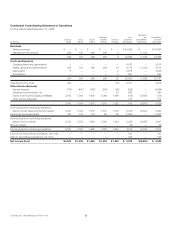
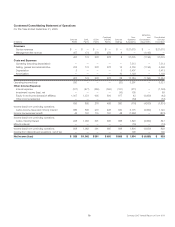
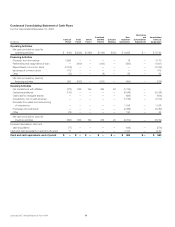
Condensed Consolidating Statement of Operations
For the Year Ended December 31, 2006
(in millions)
Comcast
Parent
CCCL
Parent
CCCH
Parent
Combined
CCHMO
Parents
Comcast
Holdings
Non-
Guarantor
Subsidiaries
Elimination
and
Consolidation
Adjustments
Consolidated
Comcast
Corporation
Revenues
Service revenues $ — $ — $ — $ — $ — $ 24,966 $ — $ 24,966
Management fee revenue 526 193 298 298 8 — (1,323) —
526 193 298 298 8 24,966 (1,323) 24,966
Costs and Expenses
Operating (excluding depreciation) — — — — — 9,010 — 9,010
Selling, general and administrative 256 193 298 298 16 6,776 (1,323) 6,514
Depreciation 8 — — — 2 3,818 — 3,828
Amortization — — — — 4 991 — 995
264 193 298 298 22 20,595 (1,323) 20,347
Operating income (loss) 262 — — — (14) 4,371 — 4,619
Other Income (Expense)
Interest expense (776) (400) (325) (259) (68) (236) — (2,064)
Investment income (loss), net — — — — 34 956 — 990
Equity in net income (losses) of affiliates 2,867 1,509 1,900 2,069 1,266 (138) (9,597) (124)
Other income (expense) — — — — — 173 — 173
2,091 1,109 1,575 1,810 1,232 755 (9,597) (1,025)
Income (loss) from continuing operations
before income taxes and minority interest 2,353 1,109 1,575 1,810 1,218 5,126 (9,597) 3,594
Income tax (expense) benefit 180 143 114 90 26 (1,900) — (1,347)
Income (loss) from continuing operations
before minority interest 2,533 1,252 1,689 1,900 1,244 3,226 (9,597) 2,247
Minority interest — — — — — (12) — (12)
Income (loss) from continuing operations 2,533 1,252 1,689 1,900 1,244 3,214 (9,597) 2,235
Income from discontinued operations, net of tax — — — — — 103 — 103
Gain on discontinued operations, net of tax — — — — — 195 — 195
Net Income (loss) $ 2,533 $ 1,252 $ 1,689 $ 1,900 $ 1,244 $ 3,512 $ (9,597) $ 2,533
Comcast 2007 Annual Report on Form 10-K 72