Comcast 2007 Annual Report Download - page 29
Download and view the complete annual report
Please find page 29 of the 2007 Comcast annual report below. You can navigate through the pages in the report by either clicking on the pages listed below, or by using the keyword search tool below to find specific information within the annual report.-
 1
1 -
2
-
3
-
4
-
5
-
6
-
7
-
8
-
9
-
10
-
11
-
12
-
13
-
14
-
15
-
16
-
17
-
18
-
 19
19 -
 20
20 -
 21
21 -
 22
22 -
 23
23 -
 24
24 -
 25
25 -
 26
26 -
 27
27 -
 28
28 -
 29
29 -
 30
30 -
 31
31 -
 32
32 -
 33
33 -
 34
34 -
 35
35 -
 36
36 -
 37
37 -
 38
38 -
 39
39 -
40
-
41
-
42
-
43
-
44
-
45
-
46
-
47
-
48
-
49
-
50
-
51
-
52
-
53
-
54
-
55
-
56
-
57
-
58
-
59
-
60
-
61
-
62
-
63
-
64
-
65
-
66
-
67
-
68
-
69
-
70
-
71
-
72
-
73
-
74
-
75
-
76
-
77
-
78
-
79
-
80
-
81
-
82
-
83
-
84
-
85
-
86
-
87
-
88
 |
 |

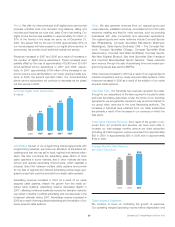
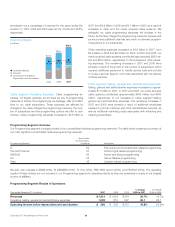
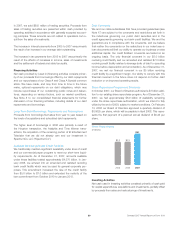
Programming Segment Revenues
Programming revenues for 2007 and 2006 increased as a result of
continued growth in advertising driven by strong ratings, and growth
in affiliate and international revenue. For 2007, 2006 and 2005,
approximately 11% to 13% of our Programming segment revenues
were generated from our Cable segment. These amounts are elimi-
nated in our consolidated financial statements but are included in
the amounts presented above.
Programming Segment Operating, Selling, General and
Administrative Expenses
Operating, selling, general and administrative expenses consist
mainly of the cost of producing television programs and live events,
the purchase of programming rights, the marketing and promotion
of our programming networks, and administrative costs. Program-
ming expenses for 2007, 2006 and 2005 increased as a result of an
increase in the production of, and programming rights costs for,
new and live-event programming for our programming networks,
including the PGA Tour on The Golf Channel and the NHL on
VERSUS, as well as a corresponding increase in marketing ex-
penses for this programming. We have invested and expect to con-
tinue to invest in new and live-event programming that will cause our
Programming segment expenses to increase in the future.
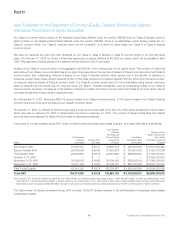
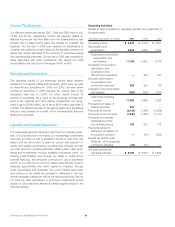
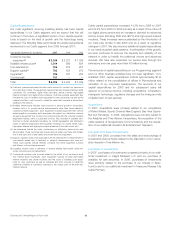
Consolidated Other Income (Expense) Items
Year ended December 31 (in millions) 2007 2006 2005
Interest expense $ (2,289) $ (2,064) $ (1,795)
Investment income (loss), net 601 990 89
Equity in net (losses) income
of affiliates, net (63) (124) (42)
Other income (expense) 522 173 (53)
Total $ (1,229) $ (1,025) $ (1,801)
Interest Expense
The increases in interest expense for 2007 from 2006 were primar-
ily the result of increases in our average debt outstanding. The
increase for 2006 from 2005 was primarily the result of an increase
in our average debt outstanding and higher interest rates on our
variable-rate debt, as well as $57 million of gains recognized in
2005 in connection with the early extinguishment of some of our
debt facilities.
Investment Income (Loss), Net
The components of investment income (loss), net for 2007, 2006
and 2005 are presented in a table in Note 6 to our consolidated
financial statements. In connection with the Adelphia and Time
Warner transactions, we recognized investment income of approx-
imately $646 million for the year ended December 31, 2006.
We have entered into derivative financial instruments that we
account for at fair value and which economically hedge the market
price fluctuations in the common stock of substantially all of our
investments accounted for as trading securities. The differences
between the unrealized gains (losses) on trading securities and the
mark to market adjustments on derivatives related to trading secu-
rities, as presented in the table in Note 6, result from one or more
of the following:
• we did not maintain an economic hedge for our entire invest-
ment in the security during some or all of the period
• there were changes in the derivative valuation assumptions such
as interest rates, volatility and dividend policy
• the magnitude of the difference between the market price of the
underlying security to which the derivative relates and the strike
price of the derivative
• the change in the time value component of the derivative value
during the period
• the security to which the derivative relates changed due to a
corporate reorganization of the issuing company to a security
with a different volatility rate
Equity in Net (Losses) Income of Affiliates, Net
The decrease in equity in net losses of affiliates for 2007 from
2006 and the increase in equity in net losses of affiliates for 2006
from 2005 were primarily a result of $59 million of other-than-
temporary impairment charges recognized in 2006.
Other Income (Expense)
Other income for 2007 consists primarily of a gain of approx-
imately $500 million on the sale of our 50% interest in the Kansas
City Asset Pool in connection with the Houston transaction. Other
income for 2006 consists primarily of $170 million of gains on the
sales of investment assets. Other expense for 2005 consists pri-
marily of a $170 million payment representing our share of the
settlement amount related to certain of AT&T’s litigation with At
Home, partially offset by a $24 million gain on the exchange of one
of our equity method investments and $62 million of gains recog-
nized on the sale or restructuring of investment assets.
27 Comcast 2007 Annual Report on Form 10-K