Comcast 2007 Annual Report Download - page 26
Download and view the complete annual report
Please find page 26 of the 2007 Comcast annual report below. You can navigate through the pages in the report by either clicking on the pages listed below, or by using the keyword search tool below to find specific information within the annual report.-
 1
1 -
2
-
3
-
4
-
5
-
6
-
7
-
8
-
9
-
10
-
11
-
12
-
13
-
14
-
15
-
 16
16 -
 17
17 -
 18
18 -
 19
19 -
 20
20 -
 21
21 -
 22
22 -
 23
23 -
 24
24 -
 25
25 -
 26
26 -
 27
27 -
 28
28 -
 29
29 -
 30
30 -
 31
31 -
 32
32 -
 33
33 -
 34
34 -
 35
35 -
 36
36 -
37
-
38
-
39
-
40
-
41
-
42
-
43
-
44
-
45
-
46
-
47
-
48
-
49
-
50
-
51
-
52
-
53
-
54
-
55
-
56
-
57
-
58
-
59
-
60
-
61
-
62
-
63
-
64
-
65
-
66
-
67
-
68
-
69
-
70
-
71
-
72
-
73
-
74
-
75
-
76
-
77
-
78
-
79
-
80
-
81
-
82
-
83
-
84
-
85
-
86
-
87
-
88
 |
 |
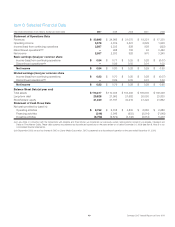
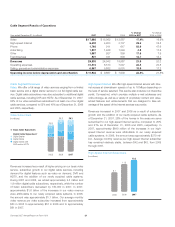
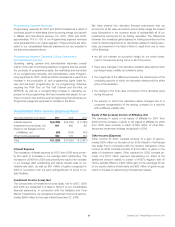
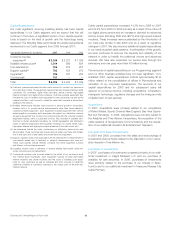
Cable Segment Results of Operations
Year ended December 31 (in millions) 2007 2006 2005
% Change
2006 to 2007
% Change
2005 to 2006
Video $ 17,686 $ 15,062 $ 12,887 17.4% 16.9%
High-speed Internet 6,402 4,953 3,737 29.2 32.5
Phone 1,766 911 617 93.9 47.6
Advertising 1,537 1,468 1,249 4.5 17.6
Other 1,087 927 859 17.5 7.9
Franchise fees 827 721 638 14.7 13.1
Revenues 29,305 24,042 19,987 21.9 20.3
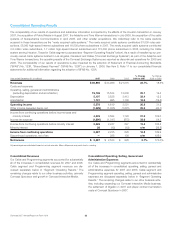
Operating expenses 10,416 8,513 7,047 22.3 20.8
Selling, general and administrative expenses 6,967 5,862 5,001 18.9 17.2
Operating income before depreciation and amortization $ 11,922 $ 9,667 $ 7,939 23.3% 21.8%
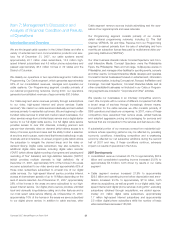
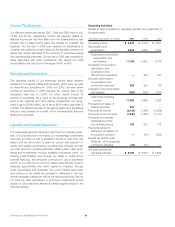
Cable Segment Revenues
Video. We offer a full range of video services ranging from a limited
basic service and a digital starter service to our full digital cable ser-
vice. Digital cable subscribers may also subscribe to additional digital
cable services, including DVR and HDTV. As of December 31, 2007,
63% of our video subscribers subscribed to at least one of our digital
cable services, compared to 52% and 45% as of December 31, 2006
and 2005, respectively.
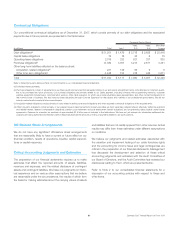
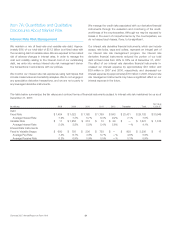
V
ideo Subscribers
(in millions)
20072006
2005
0.8
2.3
6.0
11.2
2.0
6.2
4.5
11.5
3.5
5.4
6.3
8.9
Basic Cable Subscribers
Digital Cable Subscribers*
Digital Starter
Digital Cable
Digital Cable with
DVR and/or HDTV
20.3
24.2 24.1
Revenues increased as a result of higher pricing on our basic video
service, subscriber growth in our digital cable services, including
demand for digital features such as video on demand, DVR and
HDTV, and the addition of our newly acquired cable systems.
During 2007 and 2006, we added approximately 2.5 million and
1.9 million digital cable subscribers, respectively, while the number
of basic subscribers decreased by 180,000 in 2007. In 2007,
approximately $1.6 billion of the increases in our video revenue
were attributable to our newly acquired cable systems. In 2006,
the amount was approximately $1.1 billion. Our average monthly
video revenue per video subscriber increased from approximately
$53 in 2005 to approximately $57 in 2006 and to approximately
$61 in 2007.
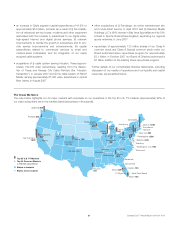
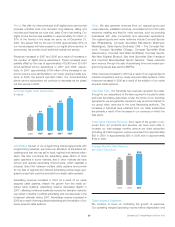
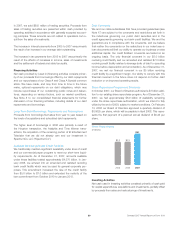
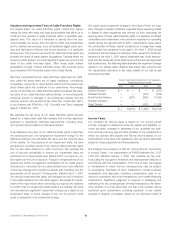
High-Speed Internet. We offer high-speed Internet service with Inter-
net access at downstream speeds of up to 16 Mbps depending on
the level of service selected. This service also includes our interactive
portal, Comcast.net, which provides multiple e-mail addresses and
online storage, as well as a variety of proprietary content and value-
added features and enhancements that are designed to take ad-
vantage of the speed of the Internet services we provide.
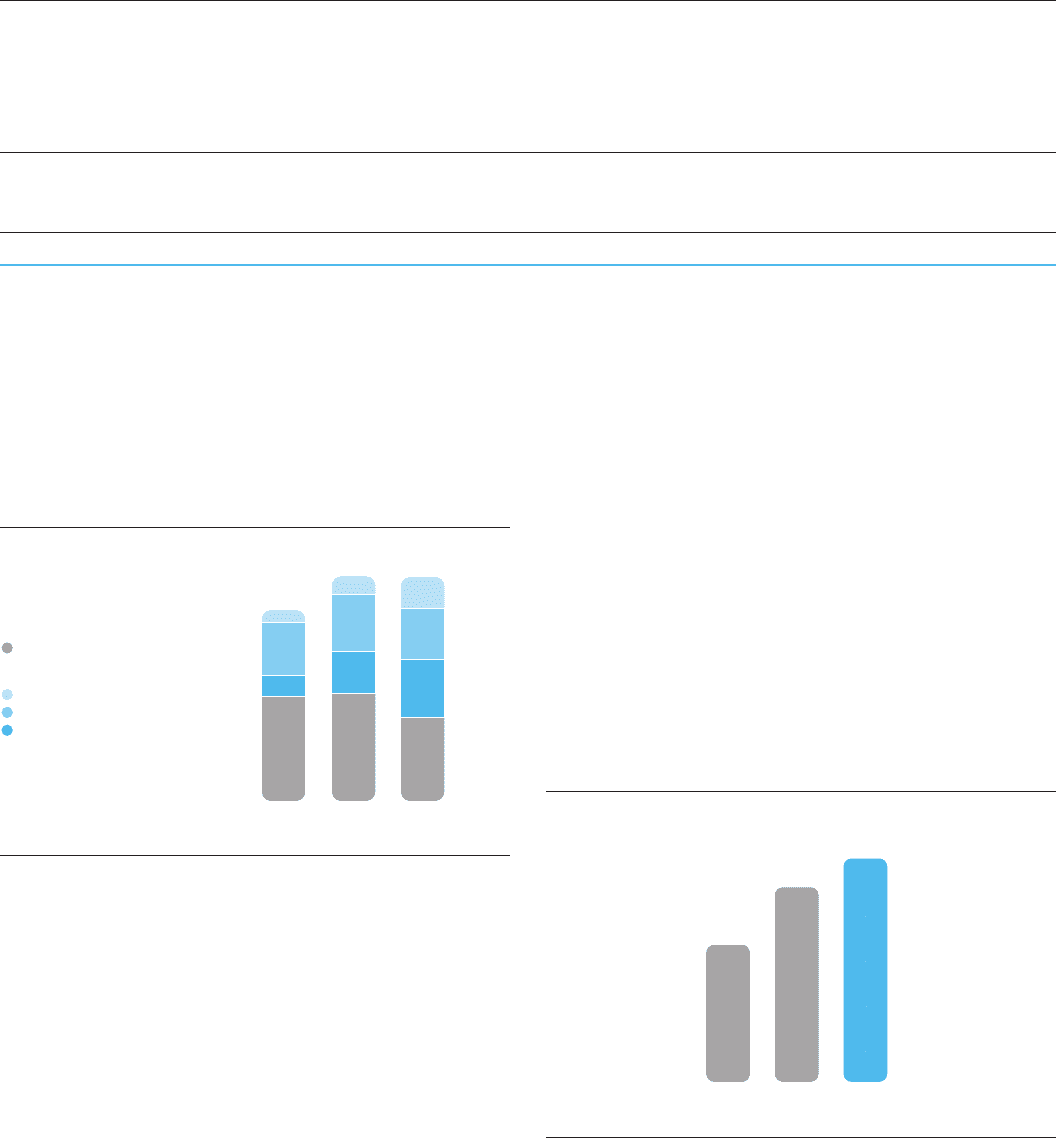
Revenues increased in 2007 and 2006 as a result of subscriber
growth and the addition of our newly acquired cable systems. As
of December 31, 2007, 28% of the homes in the areas we serve
subscribed to our high-speed Internet service, compared to 25%
and 21% as of December 31, 2006 and 2005, respectively. In
2007, approximately $640 million of the increases in our high-
speed Internet revenue were attributable to our newly acquired
cable systems. In 2006, the amount was approximately $370 mil-
lion. Average monthly revenue per high-speed Internet subscriber
has remained relatively stable, between $42 and $43, from 2005
through 2007.
High-Speed Internet Subscribers
(in millions)
8.1
11.5
13.2
2007
2006
2005
Comcast 2007 Annual Report on Form 10-K 24