Comcast 2007 Annual Report Download - page 20
Download and view the complete annual report
Please find page 20 of the 2007 Comcast annual report below. You can navigate through the pages in the report by either clicking on the pages listed below, or by using the keyword search tool below to find specific information within the annual report.-
 1
1 -
2
-
3
-
4
-
5
-
6
-
7
-
8
-
9
-
 10
10 -
 11
11 -
 12
12 -
 13
13 -
 14
14 -
 15
15 -
 16
16 -
 17
17 -
 18
18 -
 19
19 -
 20
20 -
 21
21 -
 22
22 -
 23
23 -
 24
24 -
 25
25 -
 26
26 -
 27
27 -
 28
28 -
 29
29 -
 30
30 -
31
-
32
-
33
-
34
-
35
-
36
-
37
-
38
-
39
-
40
-
41
-
42
-
43
-
44
-
45
-
46
-
47
-
48
-
49
-
50
-
51
-
52
-
53
-
54
-
55
-
56
-
57
-
58
-
59
-
60
-
61
-
62
-
63
-
64
-
65
-
66
-
67
-
68
-
69
-
70
-
71
-
72
-
73
-
74
-
75
-
76
-
77
-
78
-
79
-
80
-
81
-
82
-
83
-
84
-
85
-
86
-
87
-
88
 |
 |

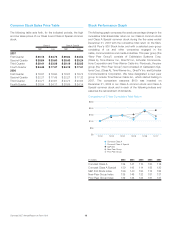
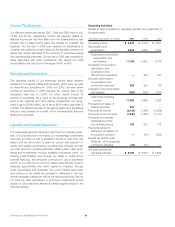
Common Stock Sales Price Table
The following table sets forth, for the indicated periods, the high
and low sales prices of our Class A and Class A Special common
stock.
Class A Class A Special
High Low High Low
2007
First Quarter $ 30.18 $ 24.73 $ 29.64 $ 24.54
Second Quarter $ 28.84 $ 25.60 $ 28.43 $ 25.24
Third Quarter $ 29.41 $ 23.08 $ 29.19 $ 22.85
Fourth Quarter $ 24.45 $ 17.37 $ 24.19 $ 17.31
2006
First Quarter $ 18.97 $ 16.90 $ 18.87 $ 16.73
Second Quarter $ 22.37 $ 17.45 $ 22.27 $ 17.33
Third Quarter $ 24.77 $ 20.67 $ 24.74 $ 20.64
Fourth Quarter $ 28.94 $ 24.17 $ 28.69 $ 24.14
Stock Performance Graph
The following graph compares the yearly percentage change in the
cumulative total shareholder return on our Class A common stock
and Class A Special common stock during the five years ended
December 31, 2007 with the cumulative total return on the Stan-
dard & Poor’s 500 Stock Index and with a selected peer group
consisting of us and other companies engaged in the
cable, communications and media industries. This peer group (the
“New Peer Group”) consists of Cablevision Systems Corp.
(Class A), Time Warner Inc., DirecTV Inc., Echostar Communica-
tions Corporation and Time Warner Cable Inc. Previously, the peer
group (the “Prior Peer Group”) had consisted of Cablevision Sys-
tems Corp. (Class A), Time Warner Inc., DirecTV Inc. and Echostar
Communications Corporation. We have designated a new peer
group to include Time Warner Cable Inc., which started trading in
2007. The comparison assumes $100 was invested on
December 31, 2002 in our Class A common stock and Class A
Special common stock and in each of the following indices and
assumes the reinvestment of dividends.
Comparison of 5 Year Cumulative Total Return
$0
$50
$100
$150
$200
$250
12/0712/0612/0512/0412/0312/02
• Comcast Class A
• Comcast Class A Special
• S&P 500
• New Peer Group
• Prior Peer Group
(in dollars) 2003 2004 2005 2006 2007
Comcast Class A 139 141 110 180 116
Comcast Class A Special 139 145 114 185 120
S&P 500 Stock Index 129 143 150 173 183
New Peer Group Index 139 146 123 181 137
Prior Peer Group Index 139 146 123 181 137
Comcast 2007 Annual Report on Form 10-K 18