Comcast 2007 Annual Report Download - page 28
Download and view the complete annual report
Please find page 28 of the 2007 Comcast annual report below. You can navigate through the pages in the report by either clicking on the pages listed below, or by using the keyword search tool below to find specific information within the annual report.-
 1
1 -
2
-
3
-
4
-
5
-
6
-
7
-
8
-
9
-
10
-
11
-
12
-
13
-
14
-
15
-
16
-
17
-
 18
18 -
 19
19 -
 20
20 -
 21
21 -
 22
22 -
 23
23 -
 24
24 -
 25
25 -
 26
26 -
 27
27 -
 28
28 -
 29
29 -
 30
30 -
 31
31 -
 32
32 -
 33
33 -
 34
34 -
 35
35 -
 36
36 -
 37
37 -
 38
38 -
39
-
40
-
41
-
42
-
43
-
44
-
45
-
46
-
47
-
48
-
49
-
50
-
51
-
52
-
53
-
54
-
55
-
56
-
57
-
58
-
59
-
60
-
61
-
62
-
63
-
64
-
65
-
66
-
67
-
68
-
69
-
70
-
71
-
72
-
73
-
74
-
75
-
76
-
77
-
78
-
79
-
80
-
81
-
82
-
83
-
84
-
85
-
86
-
87
-
88
 |
 |

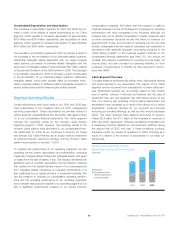
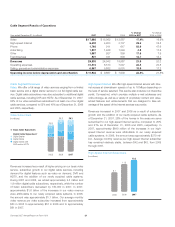
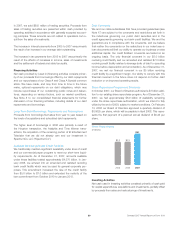
amortization as a percentage of revenue) for the years ended De-
cember 31, 2007, 2006 and 2005 were 40.7%, 40.2% and 39.8%,
respectively.
Operating Margins
(in billions)
20072006
2005
$7.9
$9.7
$11.9
$20.0
$24.0
$29.3
39.8% 40.2% 40.7%
Operating Margins
Revenue
Operating Income Before
Depreciation and Amortization
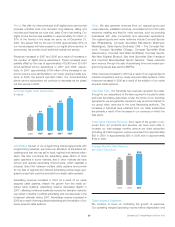
Cable Segment Operating Expenses. Cable programming ex-
penses, our largest expense, are the fees we pay to programming
networks to license the programming we package, offer and distri-
bute to our cable subscribers. These expenses are affected by
changes in the rates charged by programming networks, the num-
ber of subscribers and the programming options we offer to sub-
scribers. Cable programming expenses increased to $5.8 billion in
2007 from $4.9 billion in 2006 and $4.1 billion in 2005 as a result of
increases in rates and the newly acquired cable systems. We
anticipate our cable programming expenses will increase in the
future, as the fees charged by programming networks increase and
as we provide additional channels and video on demand program-
ming options to our subscribers.
Other operating expenses increased to $4.6 billion in 2007, from
$3.6 billion in 2006 and $2.9 billion in 2005. In 2007 and 2006, our
newly acquired cable systems contributed approximately $950 mil-
lion and $650 million, respectively, to the increases in other operat-
ing expenses. The remaining increases in 2007 and 2006 were
primarily a result of the growth in the number of subscribers, which
required additional personnel to handle service calls and provide
in-house customer support, and costs associated with the delivery
of those services.
Cable Segment Selling, General and Administrative Expenses.
Selling, general and administrative expenses increased to approx-
imately $7.0 billion in 2007. In 2007 and 2006, our newly acquired
cable systems contributed approximately $450 million and $400
million, respectively, to our increases in Cable segment selling,
general and administrative expenses. The remaining increases in
2007 and 2006 were primarily a result of additional employees
needed to provide customer and other administrative services, as
well as additional marketing costs associated with attracting and
retaining subscribers.
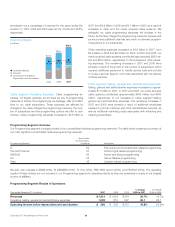
Programming Segment Overview
Our Programming segment consists primarily of our consolidated national programming networks. The table below presents a summary of
our most significant consolidated national programming networks:
Programming Network
Approximate
U.S. Subscribers
(in millions) Description
E! 82 Pop culture and entertainment-related programming
The Golf Channel 67 Golf and golf-related programming
VERSUS 64 Sports and leisure programming
G4 55 Gamer lifestyle programming
Style 48 Lifestyle-related programming
We also own interests in MGM (20%), iN DEMAND (51%), TV One (33%), PBS KIDS Sprout (40%), and FEARnet (33%). The operating
results of these entities are not included in our Programming segment’s operating results as they are presented in equity in net (losses)
income of affiliates.
Programming Segment Results of Operations
Year ended December 31 (in millions) 2007 2006 2005
% Change
2006 to 2007
% Change
2005 to 2006
Revenues $ 1,314 $ 1,054 $ 919 24.7% 14.7%
Operating, selling, general and administrative expenses 1,028 815 647 26.1 26.1
Operating income before depreciation and amortization $ 286 $ 239 $ 272 19.8% (12.2)%
Comcast 2007 Annual Report on Form 10-K 26