Comcast 2007 Annual Report Download - page 73
Download and view the complete annual report
Please find page 73 of the 2007 Comcast annual report below. You can navigate through the pages in the report by either clicking on the pages listed below, or by using the keyword search tool below to find specific information within the annual report.-
 1
1 -
2
-
3
-
4
-
5
-
6
-
7
-
8
-
9
-
10
-
11
-
12
-
13
-
14
-
15
-
16
-
17
-
18
-
19
-
20
-
21
-
22
-
23
-
24
-
25
-
26
-
27
-
28
-
29
-
30
-
31
-
32
-
33
-
34
-
35
-
36
-
37
-
38
-
39
-
40
-
41
-
42
-
43
-
44
-
45
-
46
-
47
-
48
-
49
-
50
-
51
-
52
-
53
-
54
-
55
-
56
-
57
-
58
-
59
-
60
-
61
-
62
-
 63
63 -
 64
64 -
 65
65 -
 66
66 -
 67
67 -
 68
68 -
 69
69 -
 70
70 -
 71
71 -
 72
72 -
 73
73 -
 74
74 -
 75
75 -
 76
76 -
 77
77 -
 78
78 -
 79
79 -
 80
80 -
 81
81 -
 82
82 -
 83
83 -
84
-
85
-
86
-
87
-
88
 |
 |

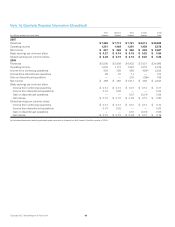
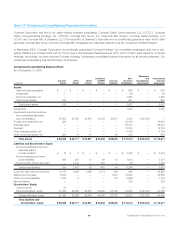
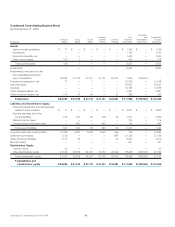
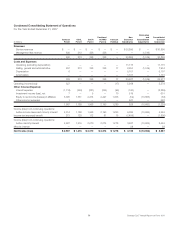
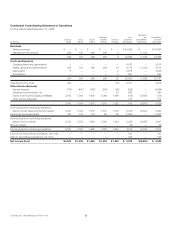
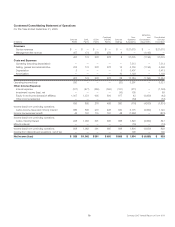
Condensed Consolidating Statement of Operations
For the Year Ended December 31, 2007
(in millions)
Comcast
Parent
CCCL
Parent
CCCH
Parent
Combined
CCHMO
Parents
Comcast
Holdings
Non-
Guarantor
Subsidiaries
Elimination
and
Consolidation
Adjustments
Consolidated
Comcast
Corporation
Revenues
Service revenues $ — $ — $ — $ — $ — $ 30,895 $ — $ 30,895
Management fee revenue 630 213 338 338 — — (1,519) —
630 213 338 338 — 30,895 (1,519) 30,895
Costs and Expenses
Operating (excluding depreciation) — — — — — 11,175 — 11,175
Selling, general and administrative 297 213 338 338 17 8,250 (1,519) 7,934
Depreciation 6 — — — — 5,101 — 5,107
Amortization — — — — — 1,101 — 1,101
303 213 338 338 17 25,627 (1,519) 25,317
Operating income (loss) 327 — — — (17) 5,268 — 5,578
Other Income (Expense)
Interest expense (1,116) (363) (321) (234) (95) (160) — (2,289)
Investment income (loss), net 7 — 5 — 70 519 — 601
Equity in net income (losses) of affiliates 3,095 1,551 2,274 2,427 1,305 (52) (10,663) (63)
Other income (expense) 1 — — — — 521 — 522
1,987 1,188 1,958 2,193 1,280 828 (10,663) (1,229)
Income (loss) from continuing operations
before income taxes and minority interest 2,314 1,188 1,958 2,193 1,263 6,096 (10,663) 4,349
Income tax (expense) benefit 273 128 112 81 15 (2,409) — (1,800)
Income (loss) from continuing operations
before minority interest 2,587 1,316 2,070 2,274 1,278 3,687 (10,663) 2,549
Minority interest — — — — — 38 — 38
Net Income (loss) $ 2,587 $ 1,316 $ 2,070 $ 2,274 $ 1,278 $ 3,725 $ (10,663) $ 2,587
71 Comcast 2007 Annual Report on Form 10-K