Comcast 2007 Annual Report Download - page 56
Download and view the complete annual report
Please find page 56 of the 2007 Comcast annual report below. You can navigate through the pages in the report by either clicking on the pages listed below, or by using the keyword search tool below to find specific information within the annual report.-
 1
1 -
2
-
3
-
4
-
5
-
6
-
7
-
8
-
9
-
10
-
11
-
12
-
13
-
14
-
15
-
16
-
17
-
18
-
19
-
20
-
21
-
22
-
23
-
24
-
25
-
26
-
27
-
28
-
29
-
30
-
31
-
32
-
33
-
34
-
35
-
36
-
37
-
38
-
39
-
40
-
41
-
42
-
43
-
44
-
45
-
 46
46 -
 47
47 -
 48
48 -
 49
49 -
 50
50 -
 51
51 -
 52
52 -
 53
53 -
 54
54 -
 55
55 -
 56
56 -
 57
57 -
 58
58 -
 59
59 -
 60
60 -
 61
61 -
 62
62 -
 63
63 -
 64
64 -
 65
65 -
 66
66 -
67
-
68
-
69
-
70
-
71
-
72
-
73
-
74
-
75
-
76
-
77
-
78
-
79
-
80
-
81
-
82
-
83
-
84
-
85
-
86
-
87
-
88
 |
 |

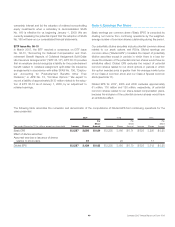
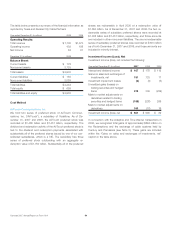
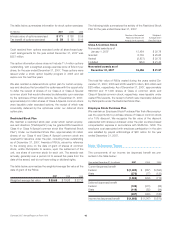
The table below presents a summary of the financial information as
reported by Texas and Kansas City Cable Partners:
Year ended December 31 (in millions) 2006 2005
Operating Results:
Total revenue $ 1,705 $1,470
Operating income 402 198
Net Income 84 81
December 31 (in millions) 2006
Balance Sheet:
Current assets $ 178
Noncurrent assets 2,725
Total assets $ 2,903
Current liabilities $ 155
Noncurrent liabilities 2,089
Total liabilities $ 2,244
Total equity $ 659
Total liabilities and equity $ 2,903
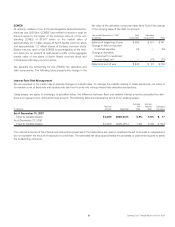
Cost Method
AirTouch Communications, Inc.
We hold two series of preferred stock of AirTouch Commun-
ications, Inc. (“AirTouch”), a subsidiary of Vodafone. As of De-
cember 31, 2007 and 2006, the AirTouch preferred stock was
recorded at $1.465 billion and $1.451 billion, respectively. The
dividend and redemption activity of the AirTouch preferred stock is
tied to the dividend and redemption payments associated with
substantially all of the preferred shares issued by one of our con-
solidated subsidiaries, which is a VIE. The subsidiary has three
series of preferred stock outstanding with an aggregate re-
demption value of $1.750 billion. Substantially all of the preferred
shares are redeemable in April 2020 at a redemption value of
$1.650 billion. As of December 31, 2007 and 2006, the two re-
deemable series of subsidiary preferred shares were recorded at
$1.465 billion and $1.451 billion, respectively, and those amounts
are included in other noncurrent liabilities. The one nonredeemable
series of subsidiary preferred shares was recorded at $100 million
as of both December 31, 2007 and 2006, and those amounts are
included in minority interest.
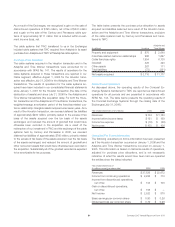
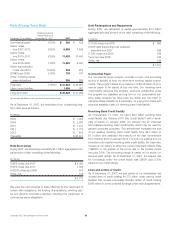
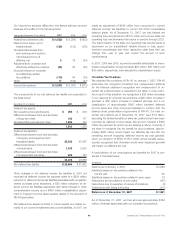
Investment Income (Loss), Net
Investment income (loss), net includes the following:
Year ended December 31 (in millions) 2007 2006 2005
Interest and dividend income $ 167 $ 178 $ 112
Gains on sales and exchanges of
investments, net 151 733 17
Investment impairment losses (4) (4) (3)
Unrealized gains (losses) on
trading securities and hedged
items 315 339 (259)
Mark to market adjustments on
derivatives related to trading
securities and hedged items (188) (238) 206
Mark to market adjustments on
derivatives 160 (18) 16
Investment income (loss), net $ 601 $ 990 $ 89
In connection with the Adelphia and Time Warner transactions in
2006, we recognized total gains of approximately $646 million on
the Redemptions and the exchange of cable systems held by
Century and Parnassos (see Note 5). These gains are included
within the “Gains on sales and exchanges of investments, net”
caption in the table above.
Comcast 2007 Annual Report on Form 10-K 54