Comcast 2007 Annual Report Download - page 30
Download and view the complete annual report
Please find page 30 of the 2007 Comcast annual report below. You can navigate through the pages in the report by either clicking on the pages listed below, or by using the keyword search tool below to find specific information within the annual report.-
 1
1 -
2
-
3
-
4
-
5
-
6
-
7
-
8
-
9
-
10
-
11
-
12
-
13
-
14
-
15
-
16
-
17
-
18
-
19
-
 20
20 -
 21
21 -
 22
22 -
 23
23 -
 24
24 -
 25
25 -
 26
26 -
 27
27 -
 28
28 -
 29
29 -
 30
30 -
 31
31 -
 32
32 -
 33
33 -
 34
34 -
 35
35 -
 36
36 -
 37
37 -
 38
38 -
 39
39 -
 40
40 -
41
-
42
-
43
-
44
-
45
-
46
-
47
-
48
-
49
-
50
-
51
-
52
-
53
-
54
-
55
-
56
-
57
-
58
-
59
-
60
-
61
-
62
-
63
-
64
-
65
-
66
-
67
-
68
-
69
-
70
-
71
-
72
-
73
-
74
-
75
-
76
-
77
-
78
-
79
-
80
-
81
-
82
-
83
-
84
-
85
-
86
-
87
-
88
 |
 |

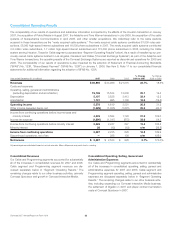
Income Tax Expense
Our effective income tax rate for 2007, 2006 and 2005 was 41.4%,
37.5% and 50.7%, respectively. Income tax expense reflects an
effective income tax rate that differs from the federal statutory rate
primarily due to state income taxes and interest on uncertain tax
positions. Our tax rate in 2006 was impacted by adjustments to
uncertain tax positions, primarily related to the favorable resolution of
issues and revised estimates of the outcome of unresolved issues
with various taxing authorities. Our tax rate in 2005 was impacted by
taxes associated with other investments. We expect our 2008
annual effective tax rate to be in the range of 40% to 45%.
Discontinued Operations
The operating results of our previously owned cable systems
located in Los Angeles, Dallas and Cleveland, which were reported
as discontinued operations for 2006 and 2005, included seven
months of operations in 2006 because the closing date of the
transaction was July 31, 2006. For 2005, results include 12
months of operations. As a result of the exchange of these sys-
tems in the Adelphia and Time Warner transactions, we recog-
nized a gain of $195 million, net of tax of $541 million (see Note 5)
in 2006. The effective tax rate on the gain is higher than the federal
statutory rate primarily as a result of the nondeductible amounts
attributed to goodwill.
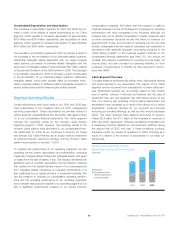
Liquidity and Capital Resources
Our businesses generate significant cash flow from operating activ-
ities. The proceeds from monetizing our nonstrategic investments
have also provided us with a significant source of cash flow. We
believe that we will be able to meet our current and long-term li-
quidity and capital requirements, including fixed charges, through
our cash flow from operating activities, existing cash, cash equiv-
alents and investments; through available borrowings under our
existing credit facilities; and through our ability to obtain future
external financing. We anticipate continuing to use a substantial
portion of our cash flow to fund our capital expenditures, invest in
business opportunities and return capital to investors, through
stock repurchases and dividends. The credit markets have been
and continue to be volatile due primarily to difficulties in the resi-
dential mortgage markets as well as the slowing economy. We do
not hold any cash equivalents or short-term investments whose
liquidity or value has been affected by these negative trends in the
financial markets.
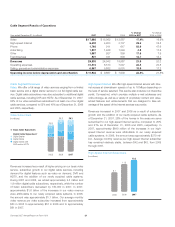
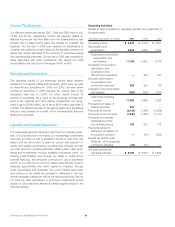
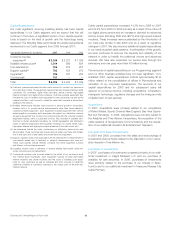
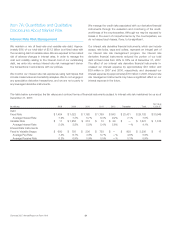
Operating Activities
Details of cash provided by operating activities are presented in
the table below:
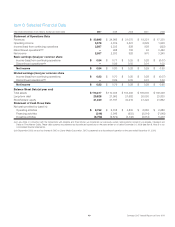
Year ended December 31 (in millions) 2007 2006 2005
Operating income $ 5,578 $ 4,619 $ 3,521
Depreciation and
amortization 6,208 4,823 4,551
Operating income before
depreciation and
amortization 11,786 9,442 8,072
Operating income before
depreciation and
amortization from
discontinued operations —264 421
Noncash share-based
compensation and
contribution expense 223 223 66
Changes in operating assets
and liabilities (200) (280) (733)
Cash basis operating
income 11,809 9,649 7,826
Proceeds from sales of
trading securities 603 ——
Payments of interest (2,134) (1,880) (1,809)
Payments of income taxes (1,638) (1,284) (1,137)
Proceeds from interest,
dividends and other
non-operating items 185 233 175
Payments related to
settlement of litigation of
an acquired company —(67) (220)
Excess tax benefit under
SFAS No. 123R presented
in financing activities (33) (33) —
Net cash provided by
operating activities $ 8,792 $ 6,618 $ 4,835
Comcast 2007 Annual Report on Form 10-K 28