Comcast 2007 Annual Report Download - page 69
Download and view the complete annual report
Please find page 69 of the 2007 Comcast annual report below. You can navigate through the pages in the report by either clicking on the pages listed below, or by using the keyword search tool below to find specific information within the annual report.-
 1
1 -
2
-
3
-
4
-
5
-
6
-
7
-
8
-
9
-
10
-
11
-
12
-
13
-
14
-
15
-
16
-
17
-
18
-
19
-
20
-
21
-
22
-
23
-
24
-
25
-
26
-
27
-
28
-
29
-
30
-
31
-
32
-
33
-
34
-
35
-
36
-
37
-
38
-
39
-
40
-
41
-
42
-
43
-
44
-
45
-
46
-
47
-
48
-
49
-
50
-
51
-
52
-
53
-
54
-
55
-
56
-
57
-
58
-
 59
59 -
 60
60 -
 61
61 -
 62
62 -
 63
63 -
 64
64 -
 65
65 -
 66
66 -
 67
67 -
 68
68 -
 69
69 -
 70
70 -
 71
71 -
 72
72 -
 73
73 -
 74
74 -
 75
75 -
 76
76 -
 77
77 -
 78
78 -
 79
79 -
80
-
81
-
82
-
83
-
84
-
85
-
86
-
87
-
88
 |
 |

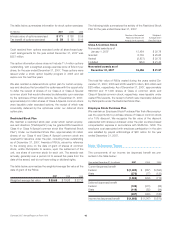
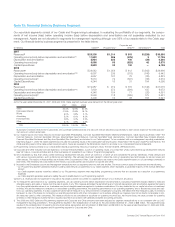
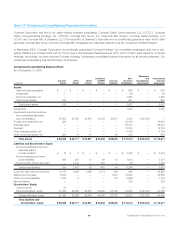
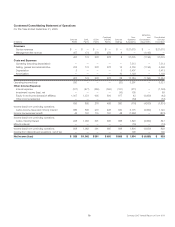
Note 15: Financial Data by Business Segment
Our reportable segments consist of our Cable and Programming businesses. In evaluating the profitability of our segments, the compo-
nents of net income (loss) below operating income (loss) before depreciation and amortization are not separately evaluated by our
management. Assets are not allocated to segments for management reporting although over 95% of our assets relate to the Cable seg-
ment. Our financial data by business segment is presented in the table below:
(in millions) Cable(a)(b) Programming(c)
Corporate and
Other(d)(e) Eliminations(e)(f) Total
2007
Revenues(g) $ 29,305 $ 1,314 $ 515 $ (239) $ 30,895
Operating income (loss) before depreciation and amortization(h) 11,922 286 (425) 3 11,786
Depreciation and amortization 5,924 223 100 (39) 6,208
Operating income (loss) 5,998 63 (525) 42 5,578
Capital Expenditures 5,993 35 130 — 6,158
2006
Revenues(g)(i) $ 24,042 $ 1,054 $ 412 $ (542) $ 24,966
Operating income (loss) before depreciation and amortization(h)(i) 9,667 239 (318) (146) 9,442
Depreciation and amortization 4,657 167 79 (80) 4,823
Operating income (loss)(i) 5,010 72 (397) (66) 4,619
Capital Expenditures 4,244 16 31 104 4,395
2005
Revenues(g) $ 19,987 $ 919 $ 315 $ (146) $ 21,075
Operating income (loss) before depreciation and amortization(h)(i) 7,939 272 (294) 155 8,072
Depreciation and amortization 4,346 154 71 (20) 4,551
Operating income (loss)(i) 3,593 118 (365) 175 3,521
Capital Expenditures 3,409 16 38 158 3,621
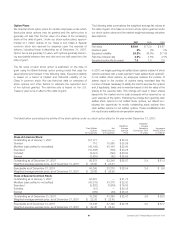
(a) For the years ended December 31, 2007, 2006 and 2005, Cable segment revenues were derived from the following services:
2007 2006 2005
Video 60.4% 62.6% 64.5%
High-speed Internet 21.9% 20.6% 18.7%
Phone 6.0% 3.8% 3.1%
Advertising 5.2% 6.1% 6.2%
Franchise Fees 2.8% 3.0% 3.2%
Other 3.7% 3.9% 4.3%
Total 100.0% 100.0% 100.0%
Subscription revenues received from subscribers who purchase bundled services at a discount rate are allocated proportionally to each service based on the individual serv-
ice’s price on a stand-alone basis.
(b) Our regional sports and news networks (Comcast SportsNet (Philadelphia), Comcast SportsNet Mid-Atlantic (Baltimore/Washington), Cable Sports Southeast, CN8—The
Comcast Network, Comcast SportsNet Chicago, MountainWest Sports Network, Comcast SportsNet West (Sacramento), Comcast SportsNet New England (Boston),
Comcast SportsNet Northwest and Bay Area SportsNet (San Francisco)) are included in our Cable segment. To be consistent with our management reporting presentation,
beginning August 1, 2006, the Cable segment also includes the operating results of the cable system serving Houston, Texas held in the Houston Asset Pool (see Note 5). The
2006 operating results of the cable system serving Houston, Texas are reversed in the Eliminations column to reconcile to our consolidated financial statements.
(c) Programming consists primarily of our consolidated national programming networks, including E!, Style, The Golf Channel, VERSUS and G4.
(d) Corporate and Other includes Comcast Spectacor, Comcast Interactive Media, a portion of operating results of our less than wholly owned technology development ventures
(see “(e)” below), corporate activities and all other businesses not presented in our Cable or Programming segments.
(e) We consolidate our less than wholly owned technology development ventures, which we control or of which we are considered the primary beneficiary. These ventures are
with various corporate partners, such as Motorola and Gemstar. The ventures have been created to share the costs of developing new technologies for set-top boxes and
other devices. The results of these entities are included within Corporate and Other. Cost allocations are made to the Cable segment based on our percentage ownership in
each entity. The remaining net costs related to the minority corporate partners are included in Corporate and Other.
(f) Included in the Eliminations column are intersegment transactions that our segments enter into with one another. The most common types of transactions are the following:
‰our Programming segment generates revenue by selling cable network programming to our Cable segment, which represents a substantial majority of the revenue elimination
amount
‰our Cable segment receives incentives offered by our Programming segment when negotiating programming contracts that are recorded as a reduction of programming
expenses
‰our Cable segment generates revenue by selling the use of satellite feeds to our Programming segment
(g) Non-U.S. revenues were not significant in any period. No single customer accounted for a significant amount of our revenue in any period.
(h) To measure the performance of our operating segments, we use operating income before depreciation and amortization, excluding impairment charges related to fixed and
intangible assets, and gains or losses from the sale of assets, if any. This measure eliminates the significant level of noncash depreciation and amortization expense that results
from the capital-intensive nature of our businesses and from intangible assets recognized in business combinations. It is also unaffected by our capital structure or investment
activities. We use this measure to evaluate our consolidated operating performance, the operating performance of our operating segments, and to allocate resources and capi-
tal to our operating segments. It is also a significant performance measure in our annual incentive compensation programs. We believe that this measure is useful to investors
because it is one of the bases for comparing our operating performance with other companies in our industries, although our measure may not be directly comparable to sim-
ilar measures used by other companies. This measure should not be considered a substitute for operating income (loss), net income (loss), net cash provided by operating
activities or other measures of performance or liquidity reported in accordance with generally accepted accounting principles.
(i) The 2006 and 2005 Cable and Programming segment and Corporate and Other amounts have been adjusted for segment reclassifications to be consistent with our 2007
management reporting presentation. The adjustments resulted in the reclassification of revenue for the year ended December 31, 2006 of $58 million. The adjustments also
resulted in the reclassification of operating income (loss) before depreciation and amortization of $39 million and $8 million for the years ended December 31, 2006 and 2005,
respectively, from our Cable segment and Programming segment to Corporate and Other.
67 Comcast 2007 Annual Report on Form 10-K