Comcast 2007 Annual Report Download - page 23
Download and view the complete annual report
Please find page 23 of the 2007 Comcast annual report below. You can navigate through the pages in the report by either clicking on the pages listed below, or by using the keyword search tool below to find specific information within the annual report.-
 1
1 -
2
-
3
-
4
-
5
-
6
-
7
-
8
-
9
-
10
-
11
-
12
-
 13
13 -
 14
14 -
 15
15 -
 16
16 -
 17
17 -
 18
18 -
 19
19 -
 20
20 -
 21
21 -
 22
22 -
 23
23 -
 24
24 -
 25
25 -
 26
26 -
 27
27 -
 28
28 -
 29
29 -
 30
30 -
 31
31 -
 32
32 -
 33
33 -
34
-
35
-
36
-
37
-
38
-
39
-
40
-
41
-
42
-
43
-
44
-
45
-
46
-
47
-
48
-
49
-
50
-
51
-
52
-
53
-
54
-
55
-
56
-
57
-
58
-
59
-
60
-
61
-
62
-
63
-
64
-
65
-
66
-
67
-
68
-
69
-
70
-
71
-
72
-
73
-
74
-
75
-
76
-
77
-
78
-
79
-
80
-
81
-
82
-
83
-
84
-
85
-
86
-
87
-
88
 |
 |
• an increase in Cable segment capital expenditures of 41.2% to
approximately $6.0 billion, primarily as a result of (i) the installa-
tion of advanced set-top boxes, modems and other equipment
associated with the increase in subscribers to our digital video,
high-speed Internet and digital phone services; (ii) network
improvements to handle the growth in subscribers and to pro-
vide service improvements and enhancements; (iii) capital
expenditures related to commercial services to small and
medium-sized businesses; and (iv) integration of our newly
acquired cable systems
• acquisitions of (i) cable system serving Houston, Texas (approx-
imately 700,000 video subscribers), resulting from the dissolu-
tion of Texas and Kansas City Cable Partners (the “Houston
transaction”), in January 2007 and (ii) the cable system of Patriot
Media, serving approximately 81,000 video subscribers in central
New Jersey, in August 2007
• other acquisitions of (i) Fandango, an online entertainment site
and movie-ticket service, in April 2007 and (ii) Rainbow Media
Holdings LLC’s 60% interest in Bay Area SportsNet and its 50%
interest in Sports Channel New England, expanding our regional
sports networks, in June 2007
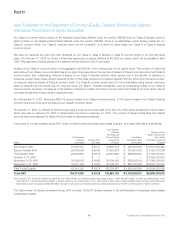
• repurchase of approximately 133 million shares of our Class A
common stock and Class A Special common stock under our
Board-authorized share repurchase program for approximately
$3.1 billion; in October 2007 our Board of Directors authorized a
$7 billion addition to the existing share repurchase program
Further details of our consolidated financial statements, including
discussion of our results of operations and our liquidity and capital
resources, are presented below.
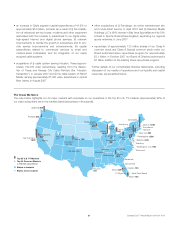
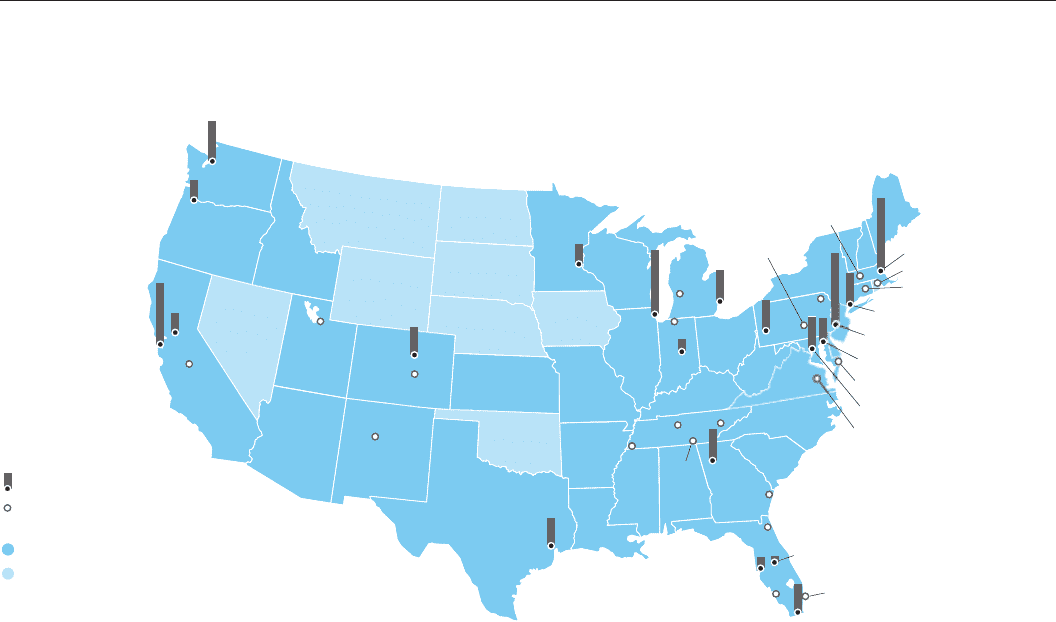
The Areas We Serve
The map below highlights our 40 major markets with emphasis on our operations in the top 25 U.S. TV markets. Approximately 92% of
our video subscribers are in the markets listed (subscribers in thousands).
Top 25 U.S. TV Markets
Top 40 Comcast Markets
(>125,000 subscribers)
States in footprint
States not in footprint
West Palm Beach
Nashville
Hartford
Grand
Rapids
Salt Lake
City
Houston
700
Atlanta
800
Baltimore 600
Washington, D.C. 900
Philadelphia 1,800
New York 800
Boston 1,600
Pittsburgh
700
Detroit
800
Miami 700
Orlando
Tampa
Indianapolis
Chicago
1,600
Minneapolis /
St. Paul
500
Denver 700
Seattle 1,000
Portland 500
Sacramento
500
San Francisco
1,500
Jacksonville
100
Ft. Myers
Richmond
Memphis
Fresno
Albuquerque
Salisbury
Knoxville
Chattanooga
Colorado
Springs
Harrisburg
South Bend
200
Savannah
Providence
Wilkes
Barre
Springfield
300
21 Comcast 2007 Annual Report on Form 10-K