Comcast 2007 Annual Report Download - page 27
Download and view the complete annual report
Please find page 27 of the 2007 Comcast annual report below. You can navigate through the pages in the report by either clicking on the pages listed below, or by using the keyword search tool below to find specific information within the annual report.-
 1
1 -
2
-
3
-
4
-
5
-
6
-
7
-
8
-
9
-
10
-
11
-
12
-
13
-
14
-
15
-
16
-
 17
17 -
 18
18 -
 19
19 -
 20
20 -
 21
21 -
 22
22 -
 23
23 -
 24
24 -
 25
25 -
 26
26 -
 27
27 -
 28
28 -
 29
29 -
 30
30 -
 31
31 -
 32
32 -
 33
33 -
 34
34 -
 35
35 -
 36
36 -
 37
37 -
38
-
39
-
40
-
41
-
42
-
43
-
44
-
45
-
46
-
47
-
48
-
49
-
50
-
51
-
52
-
53
-
54
-
55
-
56
-
57
-
58
-
59
-
60
-
61
-
62
-
63
-
64
-
65
-
66
-
67
-
68
-
69
-
70
-
71
-
72
-
73
-
74
-
75
-
76
-
77
-
78
-
79
-
80
-
81
-
82
-
83
-
84
-
85
-
86
-
87
-
88
 |
 |

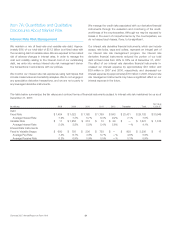
Phone. We offer our interconnected VoIP digital phone service that
provides unlimited local and domestic long-distance calling and
includes such features as voice mail, caller ID and call waiting. Our
digital phone service was available to approximately 42 million or
87% of the homes in the areas we serve, as of December 31,
2007. We expect that by the end of 2008 approximately 91% of
our homes passed will have access to our digital phone service. In
some areas, we provide circuit-switched local phone service.
Revenues increased in 2007 and 2006 as a result of increases in
the number of digital phone subscribers. These increases were
partially offset by the loss of approximately 470,000 and 330,000
circuit-switched phone subscribers in 2007 and 2006, respec-
tively. In 2007, approximately $100 million of the increases in our
phone revenue were attributable to our newly acquired cable sys-
tems. In 2006, the amount was $40 million. Our circuit-switched
phone service subscribers will continue to decrease as we phase
out this service in 2008.
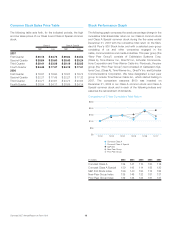
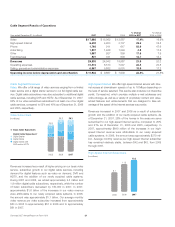
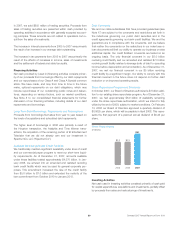
Comcast Digital Voice Subscribers
(in millions)
4Q073Q07
2Q07
1Q07
4Q06
1.9
2.4
3.1
3.8
4.4
Advertising. As part of our programming license agreements with
programming networks, we receive an allocation of scheduled ad-
vertising time that we may sell to local, regional and national adver-
tisers. We also coordinate the advertising sales efforts of other
cable operators in some markets, and in other markets we have
formed and operate advertising interconnects, which establish a
physical, direct link between multiple cable systems and provide
for the sale of regional and national advertising across larger geo-
graphic areas than could be provided by a single cable operator.
Advertising revenues increased in 2007 as a result of our newly
acquired cable systems. Absent the growth from the newly ac-
quired cable systems, advertising revenue decreased slightly in
2007, reflecting continued weakness across the television advertis-
ing market, a decline in political advertising and one less week in the
broadcast calendar during 2007. Advertising revenue increased in
2006 as a result of strong political advertising and the addition of our
newly acquired cable systems.
Other. We also generate revenues from our regional sports and
news networks, installation services, commissions from third-party
electronic retailing and fees for other services, such as providing
businesses with data connectivity and networked applications.
Our regional sports and news networks include Comcast Sports-
Net (Philadelphia), Comcast SportsNet Mid-Atlantic (Baltimore/
Washington), Cable Sports Southeast, CN8 — The Comcast Net-
work, Comcast SportsNet Chicago, Comcast SportsNet West
(Sacramento), Comcast SportsNet NorthWest, Comcast Sports-
Net New England (Boston), Bay Area SportsNet (San Francisco)
and Comcast MountainWest Sports Network. These networks
earn revenue through the sale of advertising time and receive pro-
gramming license fees paid by MVPDs.
Other revenues increased in 2007 as a result of our regional sports
network acquisitions and our newly acquired cable systems. Other
revenues increased in 2006 as a result of the addition of our newly
acquired cable systems.
Franchise Fees. Our franchise fee revenues represent the pass-
through to our subscribers of the fees required to be paid to state
and local franchising authorities. Under the terms of our franchise
agreements, we are generally required to pay an amount based on
our gross video revenues to the local franchising authority. The
increases in franchise fees collected from our cable subscribers
are primarily a result of the increases in our revenues on which the
fees apply.
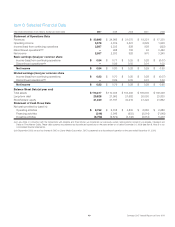
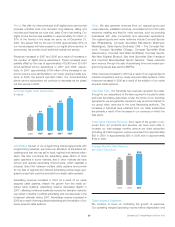
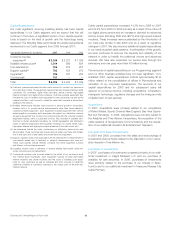
Total Cable Segment Revenue. As a result of the growth in rev-
enues from our products and services, we have been able to
increase our total average monthly revenue per video subscriber
(including all Cable segment revenue sources) from approximately
$82 in 2005 to approximately $95 in 2006 and to approximately
$102 in 2007.
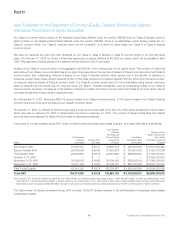
A
verage Monthly Total Revenue
per Video Subscriber
$82
$95
$102
2007
2006
2005
Cable Segment Expenses
We continue to focus on controlling the growth of expenses.
Our operating margins (operating income before depreciation and
25 Comcast 2007 Annual Report on Form 10-K