Comcast 2007 Annual Report Download - page 43
Download and view the complete annual report
Please find page 43 of the 2007 Comcast annual report below. You can navigate through the pages in the report by either clicking on the pages listed below, or by using the keyword search tool below to find specific information within the annual report.-
 1
1 -
2
-
3
-
4
-
5
-
6
-
7
-
8
-
9
-
10
-
11
-
12
-
13
-
14
-
15
-
16
-
17
-
18
-
19
-
20
-
21
-
22
-
23
-
24
-
25
-
26
-
27
-
28
-
29
-
30
-
31
-
32
-
 33
33 -
 34
34 -
 35
35 -
 36
36 -
 37
37 -
 38
38 -
 39
39 -
 40
40 -
 41
41 -
 42
42 -
 43
43 -
 44
44 -
 45
45 -
 46
46 -
 47
47 -
 48
48 -
 49
49 -
 50
50 -
 51
51 -
 52
52 -
 53
53 -
54
-
55
-
56
-
57
-
58
-
59
-
60
-
61
-
62
-
63
-
64
-
65
-
66
-
67
-
68
-
69
-
70
-
71
-
72
-
73
-
74
-
75
-
76
-
77
-
78
-
79
-
80
-
81
-
82
-
83
-
84
-
85
-
86
-
87
-
88
 |
 |

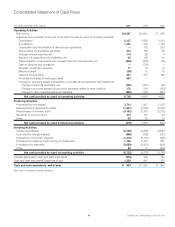
Consolidated Statement of Cash Flows
Year ended December 31 (in millions) 2007 2006 2005
Operating Activities
Net income $ 2,587 $ 2,533 $ 928
Adjustments to reconcile net income to net cash provided by (used in) operating activities:
Depreciation 5,107 3,828 3,413
Amortization 1,101 995 1,138
Depreciation and amortization of discontinued operations —139 253
Share-based compensation expenses 212 190 56
Noncash interest expense, net 114 99 8
Equity in net losses (income) of affiliates, net 63 124 42
(Gains) losses on investments and noncash other (income) expense, net (938) (979) (54)
Gain on discontinued operations —(736) —
Noncash contribution expense 11 33 10
Minority interest (38) 12 19
Deferred income taxes 247 674 183
Proceeds from sales of trading securities 603 ——
Changes in operating assets and liabilities, net of effects of acquisitions and divestitures:
Change in accounts receivable, net (100) (357) (97)
Change in accounts payable and accrued expenses related to trade creditors 175 560 (152)
Change in other operating assets and liabilities (352) (497) (912)
Net cash provided by (used in) operating activities 8,792 6,618 4,835
Financing Activities
Proceeds from borrowings 3,713 7,497 3,978
Retirements and repayments of debt (1,401) (2,039) (2,706)
Repurchases of common stock (3,102) (2,347) (2,313)
Issuances of common stock 412 410 93
Other 62 25 15
Net cash provided by (used in) financing activities (316) 3,546 (933)
Investing Activities
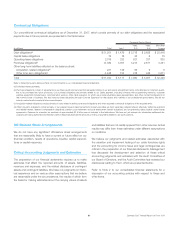
Capital expenditures (6,158) (4,395) (3,621)
Cash paid for intangible assets (406) (306) (281)
Acquisitions, net of cash acquired (1,319) (5,110) (199)
Proceeds from sales and restructuring of investments 1,158 2,720 861
Purchases of investments (2,089) (2,812) (306)
Other 62 31 (202)
Net cash provided by (used in) investing activities (8,752) (9,872) (3,748)
Increase (decrease) in cash and cash equivalents (276) 292 154
Cash and cash equivalents, beginning of year 1,239 947 793
Cash and cash equivalents, end of year $ 963 $ 1,239 $ 947
See notes to consolidated financial statements.
41 Comcast 2007 Annual Report on Form 10-K