Comcast 2007 Annual Report Download - page 59
Download and view the complete annual report
Please find page 59 of the 2007 Comcast annual report below. You can navigate through the pages in the report by either clicking on the pages listed below, or by using the keyword search tool below to find specific information within the annual report.-
 1
1 -
2
-
3
-
4
-
5
-
6
-
7
-
8
-
9
-
10
-
11
-
12
-
13
-
14
-
15
-
16
-
17
-
18
-
19
-
20
-
21
-
22
-
23
-
24
-
25
-
26
-
27
-
28
-
29
-
30
-
31
-
32
-
33
-
34
-
35
-
36
-
37
-
38
-
39
-
40
-
41
-
42
-
43
-
44
-
45
-
46
-
47
-
48
-
 49
49 -
 50
50 -
 51
51 -
 52
52 -
 53
53 -
 54
54 -
 55
55 -
 56
56 -
 57
57 -
 58
58 -
 59
59 -
 60
60 -
 61
61 -
 62
62 -
 63
63 -
 64
64 -
 65
65 -
 66
66 -
 67
67 -
 68
68 -
 69
69 -
70
-
71
-
72
-
73
-
74
-
75
-
76
-
77
-
78
-
79
-
80
-
81
-
82
-
83
-
84
-
85
-
86
-
87
-
88
 |
 |

ZONES
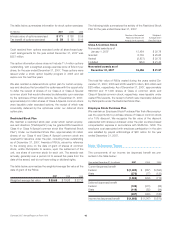
At maturity, holders of our 2.0% Exchangeable Subordinated De-
bentures due 2029 (the “ZONES”) are entitled to receive in cash an
amount equal to the higher of the principal amount of the out-
standing ZONES of $1.807 billion or the market value of
approximately 24.1 million shares of Sprint Nextel common stock
and approximately 1.2 million shares of Embarq common stock.
Before maturity, each of the ZONES is exchangeable at the hold-
er’s option for an amount of cash equal to 95% of the aggregate
market value of one share of Sprint Nextel common stock and
0.05 shares of Embarq common stock.
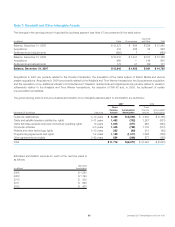
We separate the accounting for the ZONES into derivative and
debt components. The following table presents the change in the
fairvalueofthederivativecomponent(seeNote6)andthechange
in the carrying value of the debt component:
Year ended December 31, 2007
(in millions)
Debt
Component
Derivative
Component Total
Balance at beginning of year $ 596 $ 151 $ 747
Change in debt component
to interest expense 29 — 29
Change in derivative
component to investment
income (loss), net — (70) (70)
Balance at end of year $ 625 $ 81 $ 706
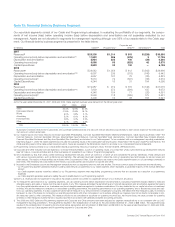
Interest Rate Risk Management
We are exposed to the market risk of adverse changes in interest rates. To manage the volatility relating to these exposures, our policy is
to maintain a mix of fixed-rate and variable-rate debt and to enter into various interest rate derivative transactions.
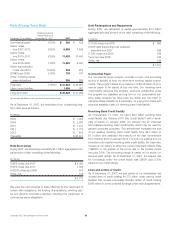
Using swaps, we agree to exchange, at specified dates, the difference between fixed and variable interest amounts calculated by refer-
ence to an agreed-upon notional principal amount. The following table summarizes the terms of our existing swaps:
(in millions)
Notional
Amount Maturities
Average
Pay
Rate
Average
Receive
Rate
Estimated
Fair Value
As of December 31, 2007
Fixed to Variable Swaps $ 3,200 2008–2014 6.8% 5.9% $ 17
As of December 31, 2006
Fixed to Variable Swaps $ 3,200 2008–2014 7.2% 5.9% $ (103)
The notional amounts of the interest rate instruments presented in the table above are used to measure interest to be paid or received and
do not represent the amount of exposure to credit loss. The estimated fair value approximates the proceeds or payments required to settle
the outstanding contracts.
57 Comcast 2007 Annual Report on Form 10-K