Comcast 2007 Annual Report Download - page 22
Download and view the complete annual report
Please find page 22 of the 2007 Comcast annual report below. You can navigate through the pages in the report by either clicking on the pages listed below, or by using the keyword search tool below to find specific information within the annual report.-
 1
1 -
2
-
3
-
4
-
5
-
6
-
7
-
8
-
9
-
10
-
11
-
 12
12 -
 13
13 -
 14
14 -
 15
15 -
 16
16 -
 17
17 -
 18
18 -
 19
19 -
 20
20 -
 21
21 -
 22
22 -
 23
23 -
 24
24 -
 25
25 -
 26
26 -
 27
27 -
 28
28 -
 29
29 -
 30
30 -
 31
31 -
 32
32 -
33
-
34
-
35
-
36
-
37
-
38
-
39
-
40
-
41
-
42
-
43
-
44
-
45
-
46
-
47
-
48
-
49
-
50
-
51
-
52
-
53
-
54
-
55
-
56
-
57
-
58
-
59
-
60
-
61
-
62
-
63
-
64
-
65
-
66
-
67
-
68
-
69
-
70
-
71
-
72
-
73
-
74
-
75
-
76
-
77
-
78
-
79
-
80
-
81
-
82
-
83
-
84
-
85
-
86
-
87
-
88
 |
 |

Item 7: Management’s Discussion and
Analysis of Financial Condition and Results
of Operations
Introduction and Overview
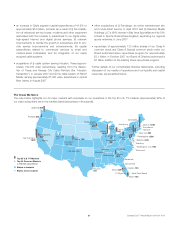
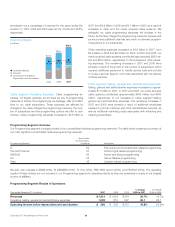
We are the largest cable operator in the United States and offer a
variety of entertainment and communications products and serv-
ices. As of December 31, 2007, our cable systems served
approximately 24.1 million video subscribers, 13.2 million high-
speed Internet subscribers and 4.6 million phone subscribers and
passed approximately 48.5 million homes in 39 states and the
District of Columbia.
We classify our operations in two reportable segments: Cable and
Programming. Our Cable segment, which generates approximately
95% of our consolidated revenues, manages and operates our
cable systems. Our Programming segment consists primarily of
our national programming networks. During 2007, our operations
generated consolidated revenues of approximately $30.9 billion.
Our Cable segment earns revenues primarily through subscriptions
to our video, high-speed Internet and phone services (“cable
services”). We market our cable services individually and as bundled
services primarily to residential customers. We are beginning to offer
bundled cable services to small and medium-sized businesses. Our
video services range from a limited basic service and a digital starter
service to our full digital cable service. Our full digital cable service
provides access to over 250 channels, including premium and
pay-per-view channels; video on demand (which allows access to a
library of movies, sports and news and the ability to start a selection
at any time and to pause, rewind and fast-forward selections); music
channels; and an interactive, on-screen program guide (which allows
the subscriber to navigate the channel lineup and the video on
demand library). Digital cable subscribers may also subscribe to
additional digital cable services, including digital video recorder
(“DVR”) (which allows digital recording of programs and pausing and
rewinding of “live” television) and high-definition television (“HDTV”)
(which provides multiple channels in high definition). As of
December 31, 2007, approximately 50% of the homes in the areas
we serve subscribed to our video service and approximately 63% of
those video subscribers subscribed to at least one of our digital
cable services. Our high-speed Internet service provides Internet
access at downstream speeds of up to 16 Mbps depending on the
level of service selected. As of December 31, 2007, approximately
28% of the homes in the areas we serve subscribed to our high-
speed Internet service. Our digital phone service provides unlimited
local and domestic long-distance calling and other features and is
our most recent cable service offering. As of December 31, 2007,
approximately 10% of the homes in the areas we serve subscribed
to our digital phone service. In addition to cable services, other
Cable segment revenue sources include advertising and the oper-
ations of our regional sports and news networks.
Our Programming segment consists primarily of our consoli-
dated national programming networks, including E!, The Golf
Channel, VERSUS, G4 and Style. Revenue from our Programming
segment is earned primarily from the sale of advertising and from
monthly per subscriber license fees paid by multichannel video pro-
gramming distributors (“MVPDs”).
Our other business interests include Comcast Spectacor and Com-
cast Interactive Media. Comcast Spectacor owns the Philadelphia
Flyers, the Philadelphia 76ers and two large, multipurpose arenas in
Philadelphia, and manages other facilities for sporting events, concerts
and other events. Comcast Interactive Media develops and operates
Comcast’s Internet businesses focused on entertainment, information
and communication, including Comcast.net, Fancast, thePlatform and
Fandango. Comcast Spectacor, Comcast Interactive Media and all
other consolidated businesses not included in our Cable or Program-
ming segments are included in “Corporate and Other” activities.
We operate our businesses in an intensely competitive environ-
ment. We compete with a number of different companies that offer
a broad range of services through increasingly diverse means.
Competition for the cable services we offer consists primarily of
DBS operators and telephone companies. In 2007, many of these
competitors have expanded their service areas, added features
and adopted aggressive pricing and packaging for services and
features that are comparable to the services and features we offer.
A substantial portion of our revenues comes from residential sub-
scribers whose spending patterns may be affected by prevailing
economic conditions. Intensifying competition and a weakening
economy affected our net subscriber additions during the second
half of 2007 and may, if these conditions continue, adversely
impact our results of operations in the future.
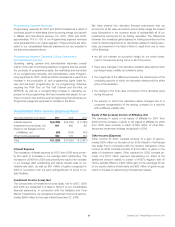
2007 Developments
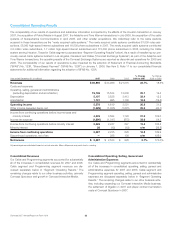
• consolidated revenue increased 23.7% to approximately $30.9
billion and consolidated operating income increased 20.8% to
approximately $5.6 billion, both driven by results in our Cable
segment
• Cable segment revenue increased 21.9% to approximately
$29.3 billion and operating income before depreciation and amor-
tization increased 23.3% to approximately $11.9 billion, both
driven by acquisitions, as well as growth in our digital cable, high-
speed Internet and digital phone services; during 2007, excluding
subscribers obtained through acquisitions, we added approx-
imately 2.5 million digital cable subscribers, approximately
1.7 million high-speed Internet subscribers and approximately
2.5 million digital phone subscribers while the number of basic
video subscribers decreased 180,000
Comcast 2007 Annual Report on Form 10-K 20