Capital One 1999 Annual Report Download - page 60
Download and view the complete annual report
Please find page 60 of the 1999 Capital One annual report below. You can navigate through the pages in the report by either clicking on the pages listed below, or by using the keyword search tool below to find specific information within the annual report.-
 1
1 -
2
-
3
-
4
-
5
-
6
-
7
-
8
-
9
-
10
-
11
-
12
-
13
-
14
-
15
-
16
-
17
-
18
-
19
-
20
-
21
-
22
-
23
-
24
-
25
-
26
-
27
-
28
-
29
-
30
-
31
-
32
-
33
-
34
-
35
-
36
-
37
-
38
-
39
-
40
-
41
-
42
-
43
-
44
-
45
-
46
-
47
-
48
-
49
-
 50
50 -
 51
51 -
 52
52 -
 53
53 -
 54
54 -
 55
55 -
 56
56 -
 57
57 -
 58
58 -
 59
59 -
 60
60 -
 61
61 -
 62
62 -
 63
63 -
 64
64 -
 65
65 -
 66
66 -
 67
67 -
 68
68 -
 69
69 -
 70
70 -
71
-
72
 |
 |

62
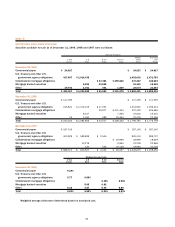
note h
INCOME TAXES
Deferred income taxes reflect the net tax effects of temporary
differences between the carrying amounts of assets and liabil-
ities for financial reporting purposes and the amounts used for
income tax purposes. Significant components of the Company’s
deferred tax assets and liabilities as of December 31, 1999 and
1998, were as follows:
December 31, 1999 1998
Deferred tax assets:
Allowance for loan losses $ 117,375 $ 75,738
Finance charge, fee and other
income receivables 111,599 57,913
Stock incentive plan 51,680 35,949
State taxes, net of federal benefit 15,131 7,310
Other 43,495 24,770
Subtotal 339,280 201,680
Valuation allowance (20,763) (14,168)
Total deferred tax assets 318,517 187,512
Deferred tax liabilities:
Securitizations 44,557 29,728
Deferred revenue 97,397 10,255
Other 17,110 7,814
Total deferred tax liabilities 159,064 47,797
Net deferred tax assets before
unrealized losses (gains) on
securities 159,453 139,715
Unrealized losses (gains) on
securities 13,369 (38,772)
Net deferred tax assets $ 172,822 $ 100,943
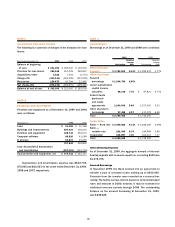
During 1999, the Company increased its valuation
allowance by $11,935 for certain state and international loss
carryforwards generated during the year. This increase in the
valuation allowance was partially offset by a decrease of $5,340
resulting from a change in tax regulations that will allow for
the recognition of the benefits of certain acquired net operat-
ing losses.
Significant components of the provision for income taxes
attributable to continuing operations were as follows:
Year Ended December 31, 1999 1998 1997
Federal taxes $ 232,910 $ 244,536 $ 138,877
State taxes 754 471 393
Deferred income taxes (19,738) (76,317) (23,198)
Income taxes $ 213,926 $ 168,690 $ 116,072
The reconciliation of income tax attributable to continuing
operations computed at the U.S. federal statutory tax rate to
income tax expense was:
Year Ended December 31, 1999 1998 1997
Income tax at statutory
federal tax rate 35.00% 35.00% 35.00%
Other 2.07 3.00 3.00
Income taxes 37.07% 38.00% 38.00%
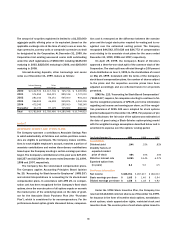
note i
EARNINGS PER SHARE
The following table sets forth the computation of basic and
diluted earnings per share:
Year Ended December 31,
(Shares in Thousands) 1999 1998 1997
Numerator:
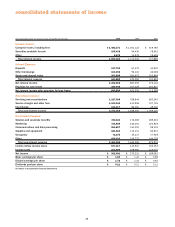
Net income $ 363,091 $ 275,231 $ 189,381
Denominator:
Denominator for basic
earnings per share —
Weighted-average shares 197,594 196,769 198,210
Effect of dilutive securities:
Stock options 13,089 11,990 4,734
Restricted stock 69
Dilutive potential
common shares 13,089 11,996 4,743
Denominator for diluted
earnings per share —
Adjusted weighted-
average shares 210,683 208,765 202,953
Basic earnings per share $ 1.84 $ 1.40 $ 0.96
Diluted earnings per share $ 1.72 $ 1.32 $ 0.93