Capital One 1999 Annual Report Download - page 24
Download and view the complete annual report
Please find page 24 of the 1999 Capital One annual report below. You can navigate through the pages in the report by either clicking on the pages listed below, or by using the keyword search tool below to find specific information within the annual report.-
 1
1 -
2
-
3
-
4
-
5
-
6
-
7
-
8
-
9
-
10
-
11
-
12
-
13
-
 14
14 -
 15
15 -
 16
16 -
 17
17 -
 18
18 -
 19
19 -
 20
20 -
 21
21 -
 22
22 -
 23
23 -
 24
24 -
 25
25 -
 26
26 -
 27
27 -
 28
28 -
 29
29 -
 30
30 -
 31
31 -
 32
32 -
 33
33 -
 34
34 -
35
-
36
-
37
-
38
-
39
-
40
-
41
-
42
-
43
-
44
-
45
-
46
-
47
-
48
-
49
-
50
-
51
-
52
-
53
-
54
-
55
-
56
-
57
-
58
-
59
-
60
-
61
-
62
-
63
-
64
-
65
-
66
-
67
-
68
-
69
-
70
-
71
-
72
 |
 |

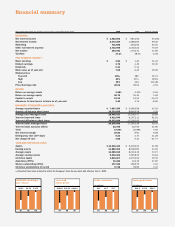
financial summary
(in millions)
11.7 16.7 23.7
97 98 99
total accounts
(in billions)
$14.2 $17.4 $20.2
97 98 99
managed loans
$18.06 $38.33 $48.19
97 98 99
year-end
stock price
$0.93 $1.32 $1.72
97 98 99
diluted earnings
per share
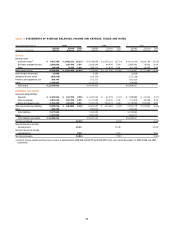
Year Ended December 31 (Dollars in Thousands, Except Per Share Data) 1999 1998 Percent Change
EARNINGS:
Net interest income $ 1,052,602 $ 687,252 53.16%
Non-interest income 2,372,359 1,488,283 59.40
Marketing 731,898 446,264 64.01
Other non-interest expense 1,733,098 1,018,322 70.19
Net income 363,091 275,231 31.92
Tax Rate 37.1% 38.0% –2.45
PER COMMON SHARE:(1)
Basic earnings $ 1.84 $ 1.40 31.43
Diluted earnings 1.72 1.32 30.30
Dividends 0.11 0.11
Book value as of year-end 7.69 6.45 19.22
Market prices
Year-end 483⁄16 381⁄325.71
High 601⁄6435⁄16 38.91
Low 354⁄5167⁄8112.48
Price/Earnings ratio 28.02 29.04 –3.51
RATIOS:
Return on average assets 3.28% 3.30% –0.61
Return on average equity 25.79 25.30 1.94
Capital to assets 12.10 14.53 –16.72
Allowance for loan losses to loans as of year-end 3.45 3.75 –8.00
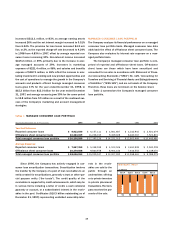
MANAGED CONSUMER LOAN DATA:
Average reported loans $ 7,667,355 $ 5,348,559 43.35
Average off-balance sheet loans 10,379,558 9,860,978 5.26
Average total managed loans 18,046,913 15,209,537 18.66
Year-end reported loans 9,913,549 6,157,111 61.01
Year-end off-balance sheet loans 10,323,039 11,238,015 –8.14
Year-end total managed loans 20,236,588 17,395,126 16.33
Year-end total accounts (000s) 23,705 16,706 41.90
Yield 17.59% 16.99% 3.53
Net interest margin 10.83 9.91 9.28
Delinquency rate (30+ days) 5.23 4.70 11.28
Net charge-off rate 3.85 5.33 –27.77
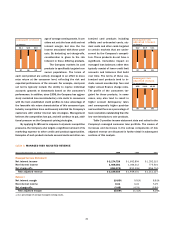
YEAR-END REPORTED DATA:
Assets $ 13,336,443 $ 9,419,403 41.58
Earning assets 11,882,402 8,238,091 44.24
Average assets 11,085,013 8,330,432 33.07
Average earning assets 9,694,406 7,225,835 34.16
Common equity 1,515,607 1,270,406 19.30
Associates (FTEs) 15,426 10,432 47.87
Shares outstanding (000s) 197,046 196,979 0.03
Common stockholders of record 9,738 9,692 0.47
(1) All periods have been restated to reflect the Company’s three-for-one stock split effective June 1, 1999.