Capital One 1999 Annual Report Download - page 29
Download and view the complete annual report
Please find page 29 of the 1999 Capital One annual report below. You can navigate through the pages in the report by either clicking on the pages listed below, or by using the keyword search tool below to find specific information within the annual report.-
 1
1 -
2
-
3
-
4
-
5
-
6
-
7
-
8
-
9
-
10
-
11
-
12
-
13
-
14
-
15
-
16
-
17
-
18
-
 19
19 -
 20
20 -
 21
21 -
 22
22 -
 23
23 -
 24
24 -
 25
25 -
 26
26 -
 27
27 -
 28
28 -
 29
29 -
 30
30 -
 31
31 -
 32
32 -
 33
33 -
 34
34 -
 35
35 -
 36
36 -
 37
37 -
 38
38 -
 39
39 -
40
-
41
-
42
-
43
-
44
-
45
-
46
-
47
-
48
-
49
-
50
-
51
-
52
-
53
-
54
-
55
-
56
-
57
-
58
-
59
-
60
-
61
-
62
-
63
-
64
-
65
-
66
-
67
-
68
-
69
-
70
-
71
-
72
 |
 |

28
INTRODUCTION
Capital One Financial Corporation (the “Corporation”) is a hold-
ing company whose subsidiaries provide a variety of products
and services to consumers using its Information-Based Strategy
(“IBS”). The principal subsidiaries are Capital One Bank (the
“Bank”), which offers credit card products, and Capital One,
F.S.B. (the “Savings Bank”), which offers consumer lending
products (including credit cards) and deposit products. The
Corporation and its subsidiaries are collectively referred to as
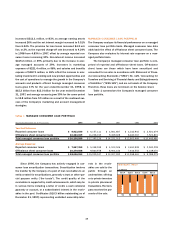
the “Company.” As of December 31, 1999, the Company had
23.7 million accounts and $20.2 billion in managed consumer
loans outstanding and was one of the largest providers of Mas-
terCard and Visa credit cards in the world.
The Company’s profitability is affected by the net interest
income and non-interest income earned on earning assets, con-
sumer usage patterns, credit quality, the level of marketing
expense and operating efficiency. The Company’s revenues con-
sist primarily of interest income on consumer loans and
securities, and non-interest income consisting of servicing
income on securitized loans, fees (such as annual membership,
cash advance, cross-sell, interchange, overlimit, past-due and
other fee income, collectively “fees”) and gains on the securiti-
zations of loans. The Company’s primary expenses are the costs
of funding assets, credit losses, operating expenses (including
salaries and associate benefits), marketing expenses and
income taxes.
Significant marketing expenses (e.g., advertising, printing,
credit bureau costs and postage) to implement the Company’s
new product strategies are incurred and expensed prior to the
acquisition of new accounts while the resulting revenues are
recognized over the life of the acquired accounts. Revenues rec-
ognized are a function of the response rate of the initial
marketing program, usage and attrition patterns, credit quality
of accounts, product pricing and effectiveness of account man-
agement programs.
EARNINGS SUMMARY
The following discussion provides a summary of 1999 results
compared to 1998 results and 1998 results compared to 1997
results. Each component is discussed in further detail in sub-
sequent sections of this analysis.
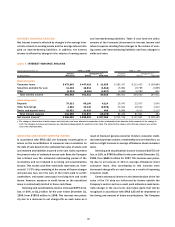
Year Ended December 31, 1999 Compared
to Year Ended December 31, 1998
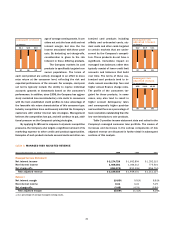
Net income of $363.1 million, or $1.72 per share, for the year
ended December 31, 1999, compares to net income of $275.2
million, or $1.32 per share, in 1998. The 32% increase in net
income of $87.9 million is primarily the result of an increase in
both asset and account volumes and an increase in net interest
margin. Net interest income increased $365.4 million, or 53%,
as average earning assets increased 34% and the net interest
margin increased to 10.86% from 9.51%. The provision for loan
losses increased $115.9 million, or 43%, as the average
reported consumer loans increased 43%, offset by the reported
net charge-off rate decrease to 3.59% in 1999 from 4.24% in
1998. Non-interest income increased $884.1 million, or 59%,
primarily due to the increase in average managed accounts of
42%. Increases in marketing expenses of $285.6 million, or
64%, and salaries and benefits expense of $303.8 million, or
64%, reflect the increase in marketing investment in existing
and new product opportunities and the cost of operations to
manage the growth in the Company’s accounts and products
offered. Average managed consumer loans grew 19% for the
year ended December 31, 1999, to $18.0 billion from $15.2 bil-
lion for the year ended December 31,
1998, and average accounts grew
42% for the same period to 19.6 mil-
lion from 13.8 million as a result
of the continued success of the
Company’s marketing and account
management strategies.
Year Ended December 31, 1998
Compared to Year Ended
December 31, 1997
Net income of $275.2 million, or
$1.32 per share, for the year ended
December 31, 1998, compares to
net income of $189.4 million, or
$.93 per share, in 1997. The 45%
increase in net income of $85.9 mil-
lion is primarily the result of an
increase in both asset and account
volumes and an increase in net inter-
est margin. Net interest income
management’s discussion and analysis of financial
condition and results of operations
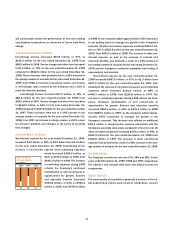
(in millions)
$189 $275 $363
97 98 99
net income
(in percentages)
23 25 26
97 98 99
return on
average equity