Capital One 1999 Annual Report Download - page 38
Download and view the complete annual report
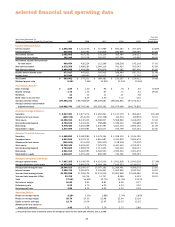
Please find page 38 of the 1999 Capital One annual report below. You can navigate through the pages in the report by either clicking on the pages listed below, or by using the keyword search tool below to find specific information within the annual report.-
 1
1 -
2
-
3
-
4
-
5
-
6
-
7
-
8
-
9
-
10
-
11
-
12
-
13
-
14
-
15
-
16
-
17
-
18
-
19
-
20
-
21
-
22
-
23
-
24
-
25
-
26
-
27
-
 28
28 -
 29
29 -
 30
30 -
 31
31 -
 32
32 -
 33
33 -
 34
34 -
 35
35 -
 36
36 -
 37
37 -
 38
38 -
 39
39 -
 40
40 -
 41
41 -
 42
42 -
 43
43 -
 44
44 -
 45
45 -
 46
46 -
 47
47 -
 48
48 -
49
-
50
-
51
-
52
-
53
-
54
-
55
-
56
-
57
-
58
-
59
-
60
-
61
-
62
-
63
-
64
-
65
-
66
-
67
-
68
-
69
-
70
-
71
-
72
 |
 |

37
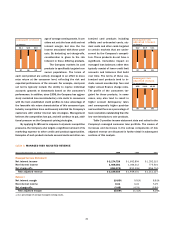
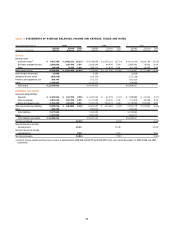
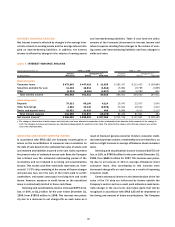
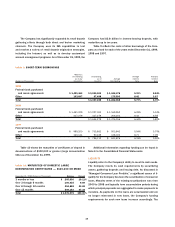
NET CHARGE-OFFS
Net charge-offs include the principal amount of losses (exclud-
ing accrued and unpaid finance charges, fees and fraud losses)
less current period recoveries. The Company charges off credit
card loans (net of any collateral) at 180 days past due.
For the year ended December 31, 1999, the managed net
charge-off rate decreased 148 basis points to 3.85%. For the
year ended December 31, 1999, the reported net charge-off
rate decreased 65 basis points to 3.59%. The decreases in man-
aged and reported net charge-off rates were the result of
improved general economic trends in consumer credit per-
formance as well as improved recovery efforts. The impact was
less apparent in the reported net charge-offs due to changes in
the composition of the reported portfolio compared to the off-
balance sheet portfolio. Table 7 shows the Company’s net
charge-offs for the years presented on a reported and man-
aged basis.
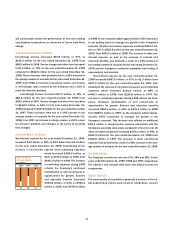
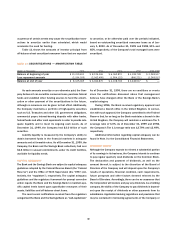
The Company’s objective is to optimize the profitability of
each account within acceptable risk characteristics. The Com-
pany takes measures as necessary, including requiring collateral
on certain accounts and other marketing and account man-
agement techniques, to maintain the Company’s credit quality
standards and to manage the risk of loss on existing accounts.
See “Risk Adjusted Revenue and Margin” for further discussion.
table 7: NET CHARGE-OFFS
Year Ended December 31 (Dollars in Thousands) 1999 1998 1997 1996 1995
Reported:
Average loans outstanding $ 7,667,355 $ 5,348,559 $ 4,103,036 $ 3,651,908 $ 2,940,208
Net charge-offs 275,470 226,531 198,192 132,590 59,618
Net charge-offs as a percentage of
average loans outstanding 3.59% 4.24% 4.83% 3.63% 2.03%
Managed:
Average loans outstanding $ 18,046,913 $ 15,209,537 $ 13,007,182 $ 11,268,461 $ 9,089,278
Net charge-offs 694,073 810,306 856,704 477,732 204,828
Net charge-offs as a percentage of
average loans outstanding 3.85% 5.33% 6.59% 4.24% 2.25%
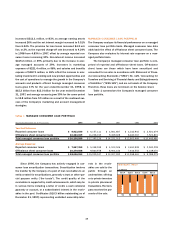
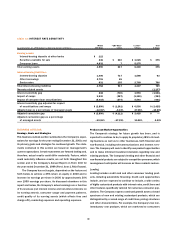
PROVISION AND ALLOWANCE FOR LOAN LOSSES
The allowance for loan losses is maintained at an amount esti-
mated to be sufficient to absorb probable future losses, net of
recoveries (including recovery of collateral), inherent in the exist-
ing reported loan portfolio. The provision for loan losses is the
periodic cost of maintaining an adequate allowance. Manage-
ment believes that the allowance for loan losses is adequate to
cover anticipated losses in the reported homogeneous con-
sumer loan portfolio under current conditions. There can be no
assurance as to future credit losses that may be incurred in con-
nection with the Company’s consumer loan portfolio, nor can
there be any assurance that the loan loss allowance that has
been established by the Company will be sufficient to absorb
such future credit losses. The allowance is a general allowance
applicable to the entire reported homogeneous consumer loan
portfolio, including the Company’s international portfolio which
to date has performed with relatively lower loss and delinquency
rates than the overall portfolio.
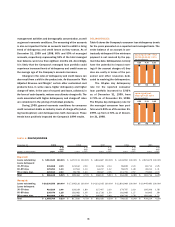
The amount of allowance necessary is determined prima-
rily based on a migration analysis of delinquent and current
accounts. In evaluating the sufficiency of the allowance for loan
losses, management also takes into consideration the following
factors: recent trends in delinquencies and charge-offs includ-
ing bankrupt, deceased and recovered amounts; historical
trends in loan volume; forecasting uncertainties and size of
credit risks; the degree of risk inherent in the composition of
the loan portfolio; economic conditions; credit evaluations and
underwriting policies. Additional information on the Company’s