Capital One 1999 Annual Report Download - page 28
Download and view the complete annual report
Please find page 28 of the 1999 Capital One annual report below. You can navigate through the pages in the report by either clicking on the pages listed below, or by using the keyword search tool below to find specific information within the annual report.-
 1
1 -
2
-
3
-
4
-
5
-
6
-
7
-
8
-
9
-
10
-
11
-
12
-
13
-
14
-
15
-
16
-
17
-
 18
18 -
 19
19 -
 20
20 -
 21
21 -
 22
22 -
 23
23 -
 24
24 -
 25
25 -
 26
26 -
 27
27 -
 28
28 -
 29
29 -
 30
30 -
 31
31 -
 32
32 -
 33
33 -
 34
34 -
 35
35 -
 36
36 -
 37
37 -
 38
38 -
39
-
40
-
41
-
42
-
43
-
44
-
45
-
46
-
47
-
48
-
49
-
50
-
51
-
52
-
53
-
54
-
55
-
56
-
57
-
58
-
59
-
60
-
61
-
62
-
63
-
64
-
65
-
66
-
67
-
68
-
69
-
70
-
71
-
72
 |
 |

27
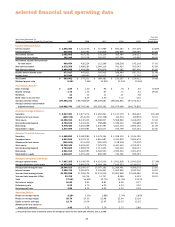
Five-Year
Year Ended December 31 Compound
(Dollars in Thousands, Except Per Share Data) 1999 1998 1997 1996 1995 Growth Rate
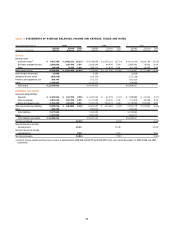
Income Statement Data:
Interest income $ 1,593,484 $ 1,111,536 $ 717,985 $ 660,483 $ 457,409 43.85%
Interest expense 540,882 424,284 341,849 294,999 249,396 42.00
Net interest income 1,052,602 687,252 376,136 365,484 208,013 44.87
Provision for loan losses 382,948 267,028 262,837 167,246 65,895 65.62
Net interest income after provision
for loan losses 669,654 420,224 113,299 198,238 142,118 37.91
Non-interest income 2,372,359 1,488,283 1,069,130 763,424 553,043 42.99
Non-interest expense 2,464,996 1,464,586 876,976 713,182 497,430 45.02
Income before income taxes 577,017 443,921 305,453 248,480 197,731 31.49
Income taxes 213,926 168,690 116,072 93,213 71,220 32.92
Net income $ 363,091 $ 275,231 $ 189,381 $ 155,267 $ 126,511 30.68
Dividend payout ratio 5.69% 7.46% 10.90% 13.24% 12.55%
Per Common Share:(1)
Basic earnings $ 1.84 $ 1.40 $ .96 $ .78 $ .64 30.83%
Diluted earnings 1.72 1.32 .93 .77 .64 29.08
Dividends .11 .11 .11 .11 .08
Book value as of year-end 7.69 6.45 4.55 3.72 3.02
Average common shares 197,593,371 196,768,929 198,209,691 198,682,893 197,072,514
Average common and common
equivalent shares 210,682,740 208,765,296 202,952,592 201,075,699 199,176,852
Selected Average Balances:
Securities $ 2,027,051 $ 1,877,276 $ 1,650,961 $ 1,147,079 $ 962,624 100.46%
Allowance for loan losses (269,375) (214,333) (132,728) (83,573) (69,939) 32.31
Total assets 11,085,013 8,330,432 6,568,937 5,568,960 4,436,055 33.34
Interest-bearing deposits 2,760,536 1,430,042 958,885 1,046,122 769,688 137.87
Borrowings 6,078,480 5,261,588 4,440,393 3,623,104 2,952,162 21.59
Stockholders’ equity 1,407,899 1,087,983 824,077 676,759 543,364 42.50
Selected Year-End Balances:
Securities $ 1,968,853 $ 2,080,980 $ 1,475,354 $ 1,358,103 $ 1,244,195
Consumer loans 9,913,549 6,157,111 4,861,687 4,343,902 2,921,679
Allowance for loan losses (342,000) (231,000) (183,000) (118,500) (72,000)
Total assets 13,336,443 9,419,403 7,078,279 6,467,445 4,759,321
Interest-bearing deposits 3,783,809 1,999,979 1,313,654 943,022 696,037
Borrowings 6,961,014 5,481,593 4,526,550 4,525,216 3,301,672
Stockholders’ equity 1,515,607 1,270,406 893,259 740,391 599,191
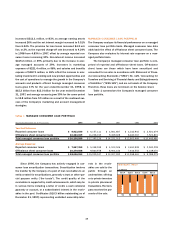
Managed Consumer Loan Data:
Average reported loans $ 7,667,355 $ 5,348,559 $ 4,103,036 $ 3,651,908 $ 2,940,208 27.38%
Average off-balance sheet loans 10,379,558 9,860,978 8,904,146 7,616,553 6,149,070 21.56
Average total managed loans 18,046,913 15,209,537 13,007,182 11,268,461 9,089,278 23.83
Interest income 3,285,736 2,583,872 2,045,967 1,662,990 1,192,100 34.97
Year-end total managed loans 20,236,588 17,395,126 14,231,015 12,803,969 10,445,480 22.36
Year-end total accounts (000s) 23,705 16,706 11,747 8,586 6,149 36.25
Yield 17.59% 16.99% 15.73% 14.76% 13.12%
Net interest margin 10.83 9.91 8.81 8.16 6.27
Delinquency rate 5.23 4.70 6.20 6.24 4.20
Net charge-off rate 3.85 5.33 6.59 4.24 2.25
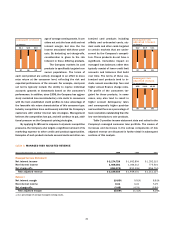
Operating Ratios:
Return on average assets 3.28% 3.30% 2.88% 2.79% 2.85%
Return on average equity 25.79 25.30 22.98 22.94 23.28
Equity to assets (average) 12.70 13.06 12.55 12.15 12.25
Allowance for loan losses to
loans as of year-end 3.45 3.75 3.76 2.73 2.86
(1) All periods have been restated to reflect the Company’s three-for-one stock split effective June 1, 1999.
selected financial and operating data