Capital One 1999 Annual Report Download - page 35
Download and view the complete annual report
Please find page 35 of the 1999 Capital One annual report below. You can navigate through the pages in the report by either clicking on the pages listed below, or by using the keyword search tool below to find specific information within the annual report.-
 1
1 -
2
-
3
-
4
-
5
-
6
-
7
-
8
-
9
-
10
-
11
-
12
-
13
-
14
-
15
-
16
-
17
-
18
-
19
-
20
-
21
-
22
-
23
-
24
-
 25
25 -
 26
26 -
 27
27 -
 28
28 -
 29
29 -
 30
30 -
 31
31 -
 32
32 -
 33
33 -
 34
34 -
 35
35 -
 36
36 -
 37
37 -
 38
38 -
 39
39 -
 40
40 -
 41
41 -
 42
42 -
 43
43 -
 44
44 -
 45
45 -
46
-
47
-
48
-
49
-
50
-
51
-
52
-
53
-
54
-
55
-
56
-
57
-
58
-
59
-
60
-
61
-
62
-
63
-
64
-
65
-
66
-
67
-
68
-
69
-
70
-
71
-
72
 |
 |

34
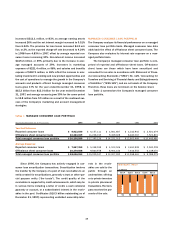
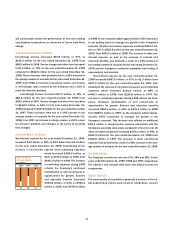
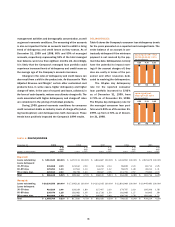
SERVICING AND SECURITIZATIONS INCOME
In accordance with SFAS 125, the Company records gains or
losses on the securitizations of consumer loan receivables on
the date of sale based on the estimated fair value of assets sold
and retained and liabilities incurred in the sale. Gains represent
the present value of estimated excess cash flows the Company
has retained over the estimated outstanding period of the
receivables and are included in servicing and securitizations
income. This excess cash flow essentially represents an “inter-
est only” (“I/O”) strip, consisting of the excess of finance charges
and past-due fees over the sum of the return paid to certifi-
cateholders, estimated contractual servicing fees and credit
losses. However, exposure to credit losses on the securitized
loans is contractually limited to these cash flows.
Servicing and securitizations income increased $397.3 mil-
lion, or 50%, to $1.2 billion for the year ended December 31,
1999, from $789.8 million in 1998. This increase was prima-
rily due to a decrease in net charge-offs on such loans as a
result of improved general economic trends in consumer credit,
increased purchase volume, membership and overlimit fees, as
well as a slight increase in average off-balance sheet consumer
loans.
Servicing and securitizations income increased $107.5 mil-
lion, or 16%, to $789.8 million for the year ended December 31,
1998, from $682.3 million for 1997. This increase was prima-
rily due to an increase of 11% in average off-balance sheet
consumer loans. Also contributing to this increase were
decreased charge-offs on such loans as a result of improving
consumer credit.
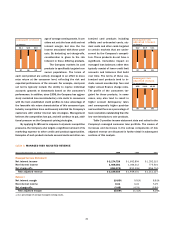
Certain estimates inherent in the determination of the fair
value of the I/O strip are influenced by factors outside the
Company’s control, and as a result, such estimates could mate-
rially change in the near term. Any future gains that will be
recognized in accordance with SFAS 125 will be dependent on
the timing and amount of future securitizations. The Company
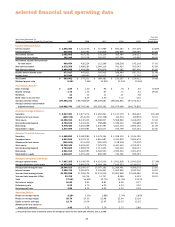
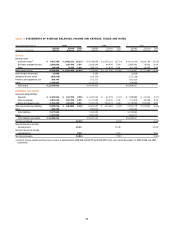
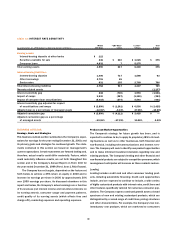
table 5: INTEREST VARIANCE ANALYSIS
Year Ended December 31 1999 vs. 1998 1998 vs. 1997
Increase Change Due to(1) Increase Change Due to(1)
(In Thousands) (Decrease) Volume Yield/Rate (Decrease) Volume Yield/Rate
Interest Income:
Consumer loans $ 479,249 $ 447,414 $ 31,835 $ 383,337 $ 213,453 $ 169,884
Securities available for sale 11,002 12,814 (1,812) 15,894 19,789 (3,895)
Other (8,303) (3,466) (4,837) (5,680) (6,281) 601
Total interest income 481,948 401,413 80,535 393,551 206,040 187,511
Interest Expense:
Deposits 70,313 66,199 4,114 25,547 22,007 3,540
Other borrowings 4,262 13,140 (8,878) 50,062 49,060 1,002
Senior and deposit notes 42,023 41,619 404 6,826 4,713 2,113
Total interest expense 116,598 131,870 (15,272) 82,435 81,941 494
Net interest income(1) $ 365,350 $ 258,291 $ 107,059 $ 311,116 $ 111,967 $ 199,149
(1) The change in interest due to both volume and yield/rates has been allocated in proportion to the relationship of the absolute dollar amounts of the change in
each. The changes in income and expense are calculated independently for each line in the table. The totals for the volume and yield/rate columns are not the
sum of the individual lines.
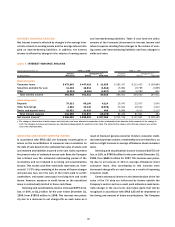
INTEREST VARIANCE ANALYSIS
Net interest income is affected by changes in the average inter-
est rate earned on earning assets and the average interest rate
paid on interest-bearing liabilities. In addition, net interest
income is affected by changes in the volume of earning assets
and interest-bearing liabilities. Table 5 sets forth the dollar
amount of the increases (decreases) in interest income and
interest expense resulting from changes in the volume of earn-
ing assets and interest-bearing liabilities and from changes in
yields and rates.