Capital One 1999 Annual Report Download - page 32
Download and view the complete annual report
Please find page 32 of the 1999 Capital One annual report below. You can navigate through the pages in the report by either clicking on the pages listed below, or by using the keyword search tool below to find specific information within the annual report.-
 1
1 -
2
-
3
-
4
-
5
-
6
-
7
-
8
-
9
-
10
-
11
-
12
-
13
-
14
-
15
-
16
-
17
-
18
-
19
-
20
-
21
-
 22
22 -
 23
23 -
 24
24 -
 25
25 -
 26
26 -
 27
27 -
 28
28 -
 29
29 -
 30
30 -
 31
31 -
 32
32 -
 33
33 -
 34
34 -
 35
35 -
 36
36 -
 37
37 -
 38
38 -
 39
39 -
 40
40 -
 41
41 -
 42
42 -
43
-
44
-
45
-
46
-
47
-
48
-
49
-
50
-
51
-
52
-
53
-
54
-
55
-
56
-
57
-
58
-
59
-
60
-
61
-
62
-
63
-
64
-
65
-
66
-
67
-
68
-
69
-
70
-
71
-
72
 |
 |

31
age of average earning assets. It con-
siders not only the loan yield and net
interest margin, but also the fee
income associated with these prod-
ucts. By deducting net charge-offs,
consideration is given to the risk
inherent in these differing products.
The Company markets its card
products to specifically targeted con-
sumer populations. The terms of
each card product are actively managed in an effort to maxi-
mize return at the consumer level, reflecting the risk and
expected performance of the account. For example, card prod-
uct terms typically include the ability to reprice individual
accounts upwards or downwards based on the consumer’s
performance. In addition, since 1998, the Company has aggres-
sively marketed low non-introductory rate cards to consumers
with the best established credit profiles to take advantage of
the favorable risk return characteristics of this consumer type.
Industry competitors have continuously solicited the Company’s
customers with similar interest rate strategies. Management
believes the competition has put, and will continue to put, addi-
tional pressure on the Company’s pricing strategies.
By applying its IBS and in response to dynamic competitive
pressures, the Company also targets a significant amount of its
marketing expense to other credit card product opportunities.
Examples of such products include secured cards and other cus-
tomized card products including
affinity and co-branded cards, stu-
dent cards and other cards targeted
to certain markets that are under-
served by the Company’s competi-
tors. These products do not have a
significant, immediate impact on
managed loan balances; rather they
typically consist of lower credit limit
accounts and balances that build
over time. The terms of these cus-
tomized card products tend to in-
clude annual membership fees and
higher annual finance charge rates.
The profile of the consumers tar-
geted for these products, in some
cases, may also tend to result in
higher account delinquency rates
and consequently higher past-due
and overlimit fees as a percentage of
loan receivables outstanding than the
low non-introductory rate products.
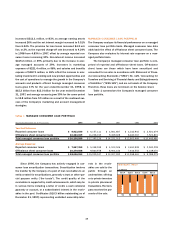
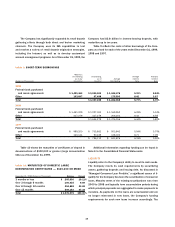
Table 3 provides income statement data and ratios for the
Company’s managed consumer loan portfolio. The causes of
increases and decreases in the various components of risk
adjusted revenue are discussed in further detail in subsequent
sections of this analysis.
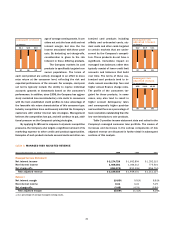
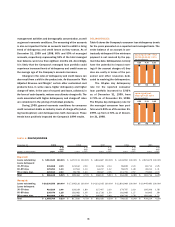
(in billions)
$1.2 $1.9 $3.1
97 98 99
managed risk
adjusted revenue
(in percentages)
8.26 11.41 15.69
97 98 99
managed risk
adjusted margin
(in billions)
$2.1 $2.8 $3.8
97 98 99
managed revenue
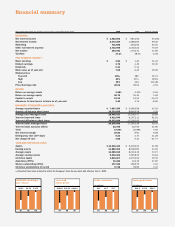
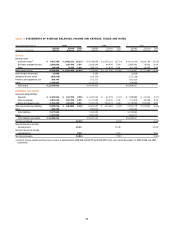
table 3: MANAGED RISK ADJUSTED REVENUE
Year Ended December 31 (Dollars in Thousands) 1999 1998 1997
Managed Income Statement:
Net interest income $ 2,174,726 $ 1,692,894 $ 1,292,315
Non-interest income 1,668,381 1,066,413 775,516
Net charge-offs (694,073) (810,306) (856,704)
Risk adjusted revenue $ 3,149,034 $ 1,949,001 $ 1,211,127
Ratios:(1)
Net interest margin 10.83% 9.91% 8.81%
Non-interest income 8.31 6.24 5.29
Net charge-offs (3.45) (4.74) (5.84)
Risk adjusted margin 15.69% 11.41% 8.26%
(1) As a percentage of average managed earning assets.