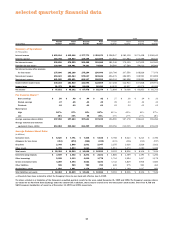
Capital One 1999 Annual Report Download - page 40
Download and view the complete annual report
Please find page 40 of the 1999 Capital One annual report below. You can navigate through the pages in the report by either clicking on the pages listed below, or by using the keyword search tool below to find specific information within the annual report.-
 1
1 -
2
-
3
-
4
-
5
-
6
-
7
-
8
-
9
-
10
-
11
-
12
-
13
-
14
-
15
-
16
-
17
-
18
-
19
-
20
-
21
-
22
-
23
-
24
-
25
-
26
-
27
-
28
-
29
-
 30
30 -
 31
31 -
 32
32 -
 33
33 -
 34
34 -
 35
35 -
 36
36 -
 37
37 -
 38
38 -
 39
39 -
 40
40 -
 41
41 -
 42
42 -
 43
43 -
 44
44 -
 45
45 -
 46
46 -
 47
47 -
 48
48 -
 49
49 -
 50
50 -
51
-
52
-
53
-
54
-
55
-
56
-
57
-
58
-
59
-
60
-
61
-
62
-
63
-
64
-
65
-
66
-
67
-
68
-
69
-
70
-
71
-
72
 |
 |

39
Company had $3.8 billion in interest-bearing deposits, with
maturities up to ten years.
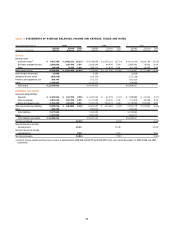
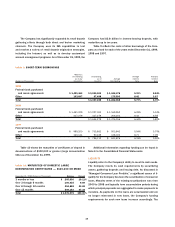
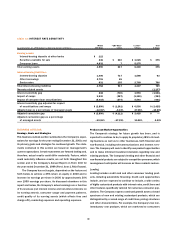
Table 9 reflects the costs of other borrowings of the Com-
pany as of and for each of the years ended December 31, 1999,
1998 and 1997.
table 9: SHORT-TERM BORROWINGS
Maximum
Outstanding Outstanding Average Year-End
as of any as of Average Interest Interest
(Dollars in Thousands) Month-End Year-End Outstanding Rate Rate
1999
Federal funds purchased
and resale agreements $ 1,491,463 $ 1,240,000 $ 1,046,475 5.33% 5.84%
Other 193,697 97,498 175,593 8.42 3.97
Total $ 1,337,498 $ 1,222,068 5.77% 5.70%
1998
Federal funds purchased
and resale agreements $ 1,451,029 $ 1,227,000 $ 1,169,952 6.09% 5.53%
Other 417,279 417,279 206,204 8.44 6.58
Total $ 1,644,279 $ 1,376,156 6.44% 5.80%
1997
Federal funds purchased
and resale agreements $ 999,200 $ 705,863 $ 503,843 5.54% 5.75%
Other 160,144 90,249 128,033 8.71 7.09
Total $ 796,112 $ 631,876 6.18% 5.90%
Table 10 shows the maturities of certificates of deposit in
denominations of $100,000 or greater (large denomination
CDs) as of December 31, 1999.
table 10: MATURITIES OF DOMESTIC LARGE
DENOMINATION CERTIFICATES — $100,000 OR MORE
December 31, 1999 (Dollars in Thousands) Balance Percent
3 months or less $ 205,630 19.11%
Over 3 through 6 months 106,435 9.89
Over 6 through 12 months 254,858 23.68
Over 12 months 509,153 47.32
Total $ 1,076,076 100.00%
Additional information regarding funding can be found in
Note E to the Consolidated Financial Statements.
LIQUIDITY
Liquidity refers to the Company’s ability to meet its cash needs.
The Company meets its cash requirements by securitizing
assets, gathering deposits and issuing debt. As discussed in
“Managed Consumer Loan Portfolio,” a significant source of li-
quidity for the Company has been the securitization of consumer
loans. Maturity terms of the existing securitizations vary from
2000 to 2008 and typically have accumulation periods during
which principal payments are aggregated to make payments to
investors. As payments on the loans are accumulated and are
no longer reinvested in new loans, the Company’s funding
requirements for such new loans increase accordingly. The
The Company has significantly expanded its retail deposit
gathering efforts through both direct and broker marketing
channels. The Company uses its IBS capabilities to test
and market a variety of retail deposit origination strategies,
including the Internet, as well as to develop customized
account management programs. As of December 31, 1999, the