Capital One 1999 Annual Report Download - page 37
Download and view the complete annual report
Please find page 37 of the 1999 Capital One annual report below. You can navigate through the pages in the report by either clicking on the pages listed below, or by using the keyword search tool below to find specific information within the annual report.-
 1
1 -
2
-
3
-
4
-
5
-
6
-
7
-
8
-
9
-
10
-
11
-
12
-
13
-
14
-
15
-
16
-
17
-
18
-
19
-
20
-
21
-
22
-
23
-
24
-
25
-
26
-
 27
27 -
 28
28 -
 29
29 -
 30
30 -
 31
31 -
 32
32 -
 33
33 -
 34
34 -
 35
35 -
 36
36 -
 37
37 -
 38
38 -
 39
39 -
 40
40 -
 41
41 -
 42
42 -
 43
43 -
 44
44 -
 45
45 -
 46
46 -
 47
47 -
48
-
49
-
50
-
51
-
52
-
53
-
54
-
55
-
56
-
57
-
58
-
59
-
60
-
61
-
62
-
63
-
64
-
65
-
66
-
67
-
68
-
69
-
70
-
71
-
72
 |
 |
36
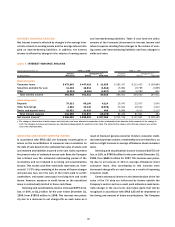
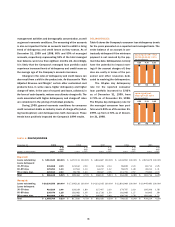
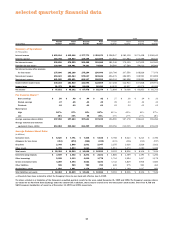
DELINQUENCIES
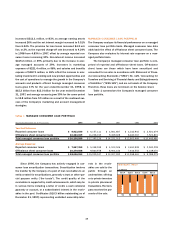
Table 6 shows the Company’s consumer loan delinquency trends
for the years presented on a reported and managed basis. The
entire balance of an account is con-
tractually delinquent if the minimum
payment is not received by the pay-
ment due date. Delinquencies not only
have the potential to impact earn-
ings if the account charges off, they
also are costly in terms of the per-
sonnel and other resources dedi-
cated to resolving the delinquencies.
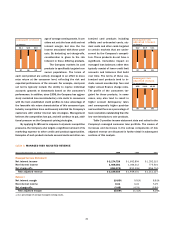
The 30-plus day delinquency
rate for the reported consumer
loan portfolio increased to 5.92%
as of December 31, 1999, from
4.70% as of December 31, 1998.
The 30-plus day delinquency rate for
the managed consumer loan port-
folio was 5.23% as of December 31,
1999, up from 4.70% as of Decem-
ber 31, 1998.
management activities and demographic concentration, as well
as general economic conditions. The seasoning of the accounts
is also an important factor as accounts tend to exhibit a rising
trend of delinquency and credit losses as they season. As of
December 31, 1999 and 1998, 60% and 59% of managed
accounts, respectively, representing 51% of the total managed
loan balance, were less than eighteen months old. Accordingly,
it is likely that the Company’s managed loan portfolio could
experience increased levels of delinquency and credit losses as
the average age of the Company’s accounts increases.
Changes in the rates of delinquency and credit losses can
also result from a shift in the product mix. As discussed in “Risk
Adjusted Revenue and Margin,” certain other customized card
products have, in some cases, higher delinquency and higher
charge-off rates. In the case of secured card loans, collateral, in
the form of cash deposits, reduces any ultimate charge-offs. The
costs associated with higher delinquency and charge-off rates
are considered in the pricing of individual products.
During 1999, general economic conditions for consumer
credit remained stable as industry levels of charge-offs (includ-
ing bankruptcies) and delinquencies both decreased. These
trends have positively impacted the Company’s 1999 results.
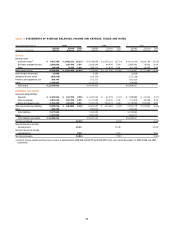
table 6: DELINQUENCIES
December 31 1999 1998 1997 1996 1995
% of % of % of % of % of
Total Total Total Total Total
(Dollars in Thousands) Loans Loans Loans Loans Loans Loans Loans Loans Loans Loans
Reported:
Loans outstanding $ 9,913,549 100.00% $ 6,157,111 100.00% $ 4,861,687 100.00% $ 4,343,902 100.00% $ 2,921,679 100.00%
Loans delinquent:
30–59 days 236,868 2.39 123,162 2.00 104,216 2.14 96,819 2.23 65,711 2.25
60–89 days 129,251 1.30 67,504 1.10 64,217 1.32 55,679 1.28 38,311 1.31
90 or more days 220,513 2.23 98,798 1.60 99,667 2.05 111,791 2.57 79,694 2.73
Total $ 586,632 5.92% $ 289,464 4.70% $ 268,100 5.51% $ 264,289 6.08% $ 183,716 6.29%
Managed:
Loans outstanding $ 20,236,588 100.00% $ 17,395,126 100.00% $ 14,231,015 100.00% $ 12,803,969 100.00% $ 10,445,480 100.00%
Loans delinquent:
30–59 days 416,829 2.06 329,239 1.89 327,407 2.30 279,787 2.19 165,306 1.58
60–89 days 238,476 1.18 182,982 1.05 213,726 1.50 162,668 1.27 92,665 .89
90 or more days 403,464 1.99 305,589 1.76 340,887 2.40 356,700 2.78 181,243 1.73
Total $ 1,058,769 5.23% $ 817,810 4.70% $ 882,020 6.20% $ 799,155 6.24% $ 439,214 4.20%
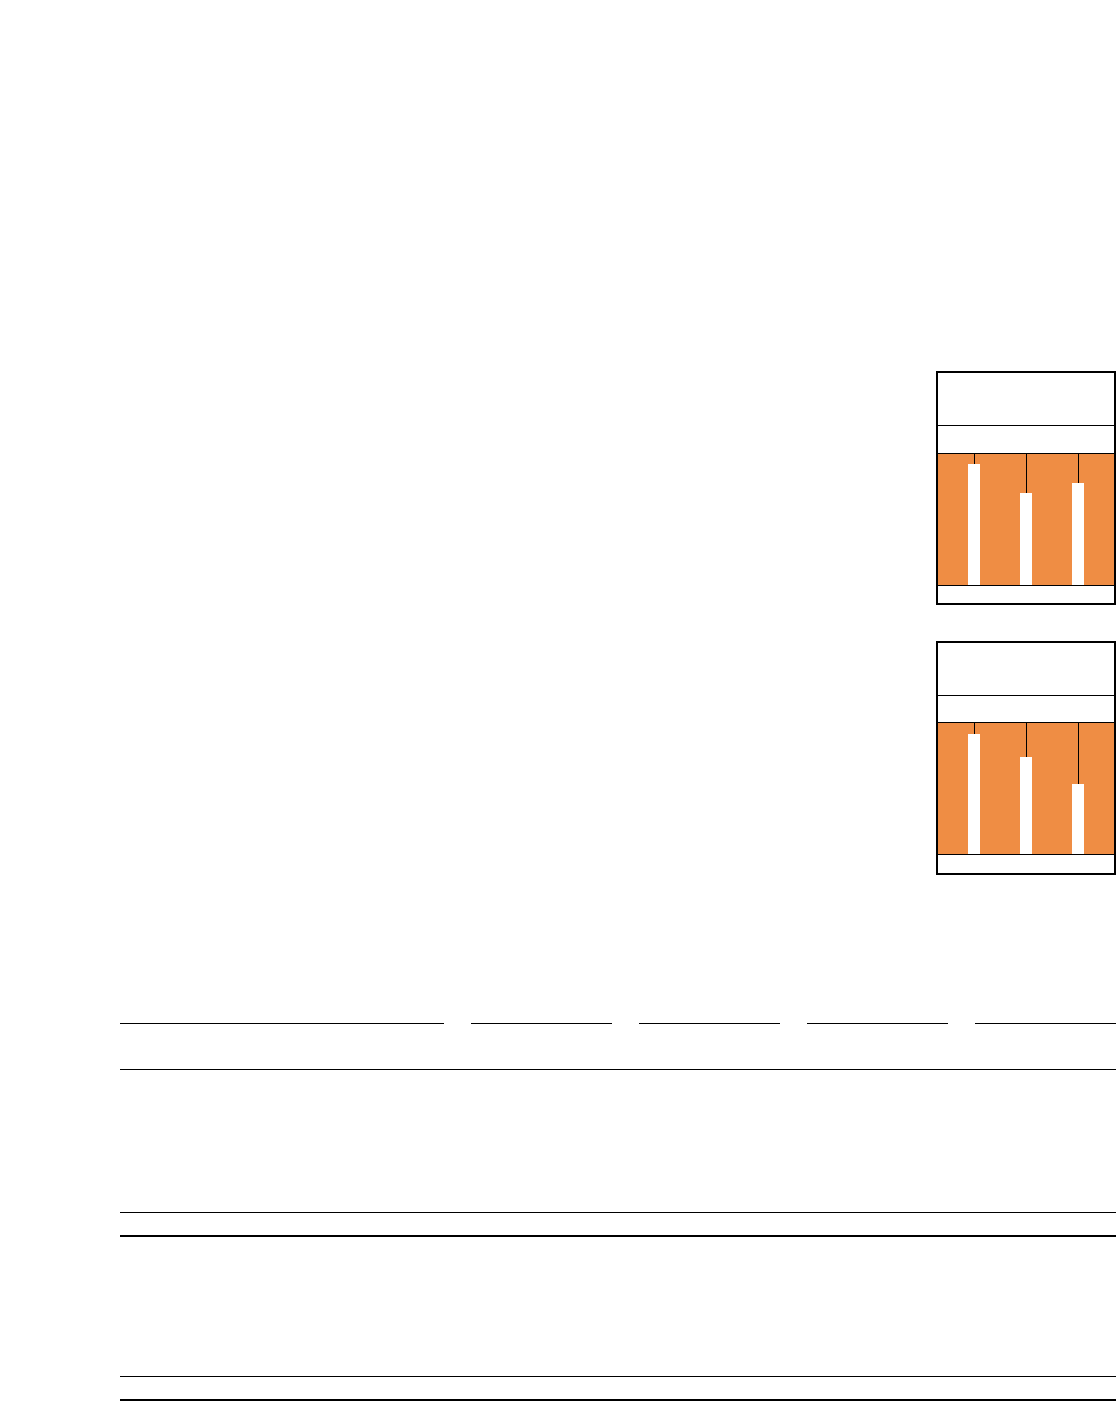
(in percentages)
6.20 4.70 5.23
97 98 99
managed 30+ day
delinquency rate
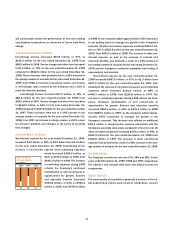
(in percentages)
6.59 5.33 3.85
97 98 99
managed net
charge-off rate