Capital One 1999 Annual Report Download - page 36
Download and view the complete annual report
Please find page 36 of the 1999 Capital One annual report below. You can navigate through the pages in the report by either clicking on the pages listed below, or by using the keyword search tool below to find specific information within the annual report.-
 1
1 -
2
-
3
-
4
-
5
-
6
-
7
-
8
-
9
-
10
-
11
-
12
-
13
-
14
-
15
-
16
-
17
-
18
-
19
-
20
-
21
-
22
-
23
-
24
-
25
-
 26
26 -
 27
27 -
 28
28 -
 29
29 -
 30
30 -
 31
31 -
 32
32 -
 33
33 -
 34
34 -
 35
35 -
 36
36 -
 37
37 -
 38
38 -
 39
39 -
 40
40 -
 41
41 -
 42
42 -
 43
43 -
 44
44 -
 45
45 -
 46
46 -
47
-
48
-
49
-
50
-
51
-
52
-
53
-
54
-
55
-
56
-
57
-
58
-
59
-
60
-
61
-
62
-
63
-
64
-
65
-
66
-
67
-
68
-
69
-
70
-
71
-
72
 |
 |

35
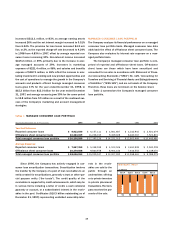
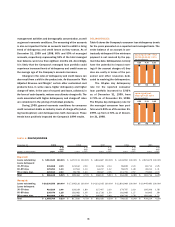
will continuously assess the performance of new and existing
securitization transactions as estimates of future cash flows
change.
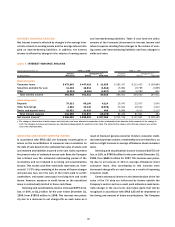
OTHER NON-INTEREST INCOME
Interchange income increased $57.8 million, or 67%, to
$144.3 million for the year ended December 31, 1999, from
$86.5 million in 1998. Service charges and other fees increased
to $1.0 billion, or 70%, for the year ended December 31, 1999
compared to $612.0 million for the year ended December 31,
1998. These increases were primarily due to a 42% increase in
the average number of accounts for the year ended December 31,
1999, from 1998, an increase in purchase volume, an increase
in interchange rates received by the Company and a shift to
more fee-intensive products.
Interchange income increased $37.5 million, or 76%, to
$86.5 million for the year ended December 31, 1998, from
$49.0 million in 1997. Service charges and other fees increased
to $612.0 million, or 81%, for the year ended December 31,
1998 compared to $337.8 million for the year ended December
31, 1997. These increases were due to a 39% increase in the
average number of accounts for the year ended December 31,
1998, from 1997, an increase in charge volume, a shift to more
fee-intensive products and changes in the terms of overlimit
fees charged.
NON-INTEREST EXPENSE
Non-interest expense for the year ended December 31, 1999,
increased $1.0 billion, or 68%, to $2.5 billion from $1.5 billion
for the year ended December 31, 1998. Contributing to the
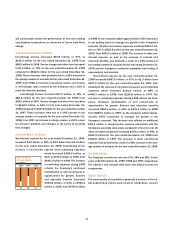
increase in non-interest expense were marketing expenses
which increased $285.6 million, or
64%, to $731.9 million in 1999, from
$446.3 million in 1998. The increase
in marketing expenses during 1999
reflects the Company’s continued
identification of and investments in
opportunities for growth. Salaries
and associate benefits increased
$303.8 million, or 64%, to $780.2
million in 1999, from $476.4 million
in 1998, as the Company added approximately 5,000 associates
to our staffing levels to manage the growth in the Company’s
accounts. All other non-interest expenses increased $411.0 mil-
lion, or 76%, to $952.9 million for the year ended December 31,
1999, from $541.9 million in 1998. The increase in other non-
interest expense, as well as the increase in salaries and
associate benefits, was primarily a result of a 42% increase in
the average number of accounts for the year ended December 31,
1999 and the Company’s continued exploration and testing of
new products and markets.
Non-interest expense for the year ended December 31,
1998 increased $587.6 million, or 67%, to $1.5 billion from
$877.0 million for the year ended December 31, 1997. Con-
tributing to the increase in non-interest expense were marketing
expenses which increased $221.4 million, or 98%, to
$446.3 million in 1998, from $224.8 million in 1997. The
increase in marketing expenses during 1998 reflects the Com-
pany’s continued identification of and investments in
opportunities for growth. Salaries and associate benefits
increased $187.1 million, or 65%, to $476.4 million in 1998
from $289.3 million in 1997, as the Company added approx-
imately 4,500 associates to manage the growth in the
Company’s accounts. This increase also reflects an additional
$45.3 million in compensation expense associated with the
Company’s associate stock plans compared to the prior year. All
other non-interest expenses increased $179.1 million, or 49%, to
$541.9 million for the year ended December 31, 1998 from
$362.8 million in 1997. The increase in other non-interest
expenses was primarily the result of a 39% increase in the aver-
age number of accounts for the year ended December 31, 1998.
INCOME TAXES
The Company’s income tax rate was 37%, 38% and 38%, for the
years ended December 31, 1999, 1998 and 1997, respectively.
The effective rate includes both state and federal income tax
components.
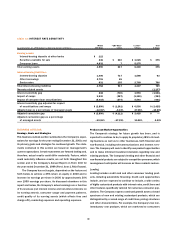
ASSET QUALITY
The asset quality of a portfolio is generally a function of the ini-
tial underwriting criteria used, levels of competition, account
(in millions)
$225 $446 $732
97 98 99
marketing
investment