Capital One 1999 Annual Report Download - page 34
Download and view the complete annual report
Please find page 34 of the 1999 Capital One annual report below. You can navigate through the pages in the report by either clicking on the pages listed below, or by using the keyword search tool below to find specific information within the annual report.-
 1
1 -
2
-
3
-
4
-
5
-
6
-
7
-
8
-
9
-
10
-
11
-
12
-
13
-
14
-
15
-
16
-
17
-
18
-
19
-
20
-
21
-
22
-
23
-
 24
24 -
 25
25 -
 26
26 -
 27
27 -
 28
28 -
 29
29 -
 30
30 -
 31
31 -
 32
32 -
 33
33 -
 34
34 -
 35
35 -
 36
36 -
 37
37 -
 38
38 -
 39
39 -
 40
40 -
 41
41 -
 42
42 -
 43
43 -
 44
44 -
45
-
46
-
47
-
48
-
49
-
50
-
51
-
52
-
53
-
54
-
55
-
56
-
57
-
58
-
59
-
60
-
61
-
62
-
63
-
64
-
65
-
66
-
67
-
68
-
69
-
70
-
71
-
72
 |
 |

33
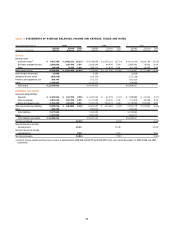
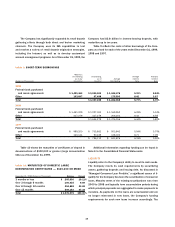
table 4: STATEMENTS OF AVERAGE BALANCES, INCOME AND EXPENSE, YIELDS AND RATES
Year Ended December 31 1999 1998 1997
Average Income/ Yield/ Average Income/ Yield/ Average Income/ Yield/
(Dollars in Thousands) Balance Expense Rate Balance Expense Rate Balance Expense Rate
Assets:
Earning assets
Consumer loans(1) $ 7,667,355 $ 1,482,371 19.33% $ 5,348,559 $ 1,003,122 18.75% $ 4,103,036 $ 619,785 15.11%
Securities available for sale 1,852,826 105,438 5.69 1,628,164 94,436 5.80 1,289,592 78,542 6.09
Other 174,225 5,675 3.26 249,112 13,978 5.61 361,369 19,658 5.44
Total earning assets 9,694,406 $ 1,593,484 16.44% 7,225,835 $ 1,111,536 15.38% 5,753,997 $ 717,985 12.48%
Cash and due from banks 17,046 4,385 (2,636)
Allowance for loan losses (269,375) (214,333) (132,728)
Premises and equipment, net 366,709 201,173 181,610
Other 1,276,227 1,113,372 768,694
Total assets $ 11,085,013 $ 8,330,432 $ 6,568,937
Liabilities and Equity:
Interest-bearing liabilities
Deposits $ 2,760,536 $ 137,792 4.99% $ 1,430,042 $ 67,479 4.72% $ 958,885 $ 41,932 4.37%
Other borrowings 1,687,042 100,392 5.95 1,473,949 96,130 6.52 721,405 46,068 6.39
Senior and deposit notes 4,391,438 302,698 6.89 3,787,639 260,675 6.88 3,718,988 253,849 6.83
Total interest-bearing liabilities 8,839,016 $ 540,882 6.12% 6,691,630 $ 424,284 6.34% 5,399,278 $ 341,849 6.33%
Other 838,098 550,819 345,582
Total liabilities 9,677,114 7,242,449 5,744,860
Equity 1,407,899 1,087,983 824,077
Total liabilities and equity $ 11,085,013 $ 8,330,432 $ 6,568,937
Net interest spread 10.32% 9.04% 6.15%
Interest income to average
earning assets 16.44 15.38 12.48
Interest expense to average
earning assets 5.58 5.87 5.94
Net interest margin 10.86% 9.51% 6.54%
(1) Interest income includes past-due fees on loans of approximately $478,918, $301,979 and $132,297 for the years ended December 31, 1999, 1998 and 1997,
respectively.