Capital One 1999 Annual Report Download - page 43
Download and view the complete annual report
Please find page 43 of the 1999 Capital One annual report below. You can navigate through the pages in the report by either clicking on the pages listed below, or by using the keyword search tool below to find specific information within the annual report.-
 1
1 -
2
-
3
-
4
-
5
-
6
-
7
-
8
-
9
-
10
-
11
-
12
-
13
-
14
-
15
-
16
-
17
-
18
-
19
-
20
-
21
-
22
-
23
-
24
-
25
-
26
-
27
-
28
-
29
-
30
-
31
-
32
-
 33
33 -
 34
34 -
 35
35 -
 36
36 -
 37
37 -
 38
38 -
 39
39 -
 40
40 -
 41
41 -
 42
42 -
 43
43 -
 44
44 -
 45
45 -
 46
46 -
 47
47 -
 48
48 -
 49
49 -
 50
50 -
 51
51 -
 52
52 -
 53
53 -
54
-
55
-
56
-
57
-
58
-
59
-
60
-
61
-
62
-
63
-
64
-
65
-
66
-
67
-
68
-
69
-
70
-
71
-
72
 |
 |

42
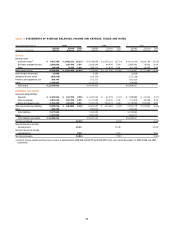
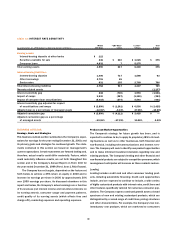
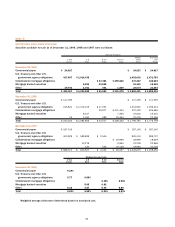
table 12: INTEREST RATE SENSITIVITY
Within >180 Days– >1 Year– Over
As of December 31, 1999 Subject to Repricing (Dollars in Millions) 180 Days 1 Year 5 Years 5 Years
Earning assets:
Interest-bearing deposits at other banks $ 112
Securities available for sale 246 $ 210 $ 1,025 $ 375
Consumer loans 4,632 7 5,275
Total earning assets 4,990 217 6,300 375
Interest-bearing liabilities:
Interest-bearing deposits 1,406 717 1,598 63
Other borrowings 2,715 65
Senior notes 631 135 2,709 706
Total interest-bearing liabilities 4,752 917 4,307 769
Non-rate related assets (1,137)
Interest sensitivity gap 238 (700) 1,993 (1,531)
Impact of swaps 1,930 (287) (1,350) (293)
Impact of consumer loan securitizations (5,018) (274) 5,893 (601)
Interest sensitivity gap adjusted for impact
of securitizations and swaps $ (2,850) $ (1,261) $ 6,536 $ (2,425)
Adjusted gap as a percentage of managed assets –12.06% –5.33% 27.65% –10.26%
Adjusted cumulative gap $ (2,850) $ (4,111) $ 2,425 $ —
Adjusted cumulative gap as a percentage
of managed assets –12.06% –17.39% 10.26% 0.00%
BUSINESS OUTLOOK
Earnings, Goals and Strategies
This business outlook section summarizes the Company’s expec-
tations for earnings for the year ending December 31, 2000, and
its primary goals and strategies for continued growth. The state-
ments contained in this section are based on management’s
current expectations. Certain statements are forward looking and,
therefore, actual results could differ materially. Factors, which
could materially influence results, are set forth throughout this
section and in the Company’s Annual Report on Form 10-K for
the year ended December 31, 1999 (Part I, Item 1, Risk Factors).
The Company has set targets, dependent on the factors set
forth below, to achieve a 25% return on equity in 2000 and to
increase its earnings per share in 2000 by approximately 30%
over 1999 earnings per share. As discussed elsewhere in this
report and below, the Company’s actual earnings are a function
of its revenues (net interest income and non-interest income on
its earning assets), consumer usage and payment patterns,
credit quality of its earning assets (which affects fees and
charge-offs), marketing expenses and operating expenses.
Product and Market Opportunities
The Company’s strategy for future growth has been, and is
expected to continue to be, to apply its proprietary IBS to its lend-
ing business as well as to other businesses, both financial and
non-financial, including telecommunications and Internet serv-
ices. The Company will seek to identify new product opportunities
and to make informed investment decisions regarding new and
existing products. The Company’s lending and other financial and
non-financial products are subject to competitive pressures, which
management anticipates will increase as these markets mature.
Lending
Lending includes credit card and other consumer lending prod-
ucts, including automobile financing. Credit card opportunities
include, and are expected to continue to include, a wide variety
of highly customized products with interest rates, credit lines and
other features specifically tailored for numerous consumer pop-
ulations. The Company expects continued growth across a broad
spectrum of new and existing customized products, which are
distinguished by a varied range of credit lines, pricing structures
and other characteristics. For example, the Company’s low non-
introductory rate products, which are marketed to consumers